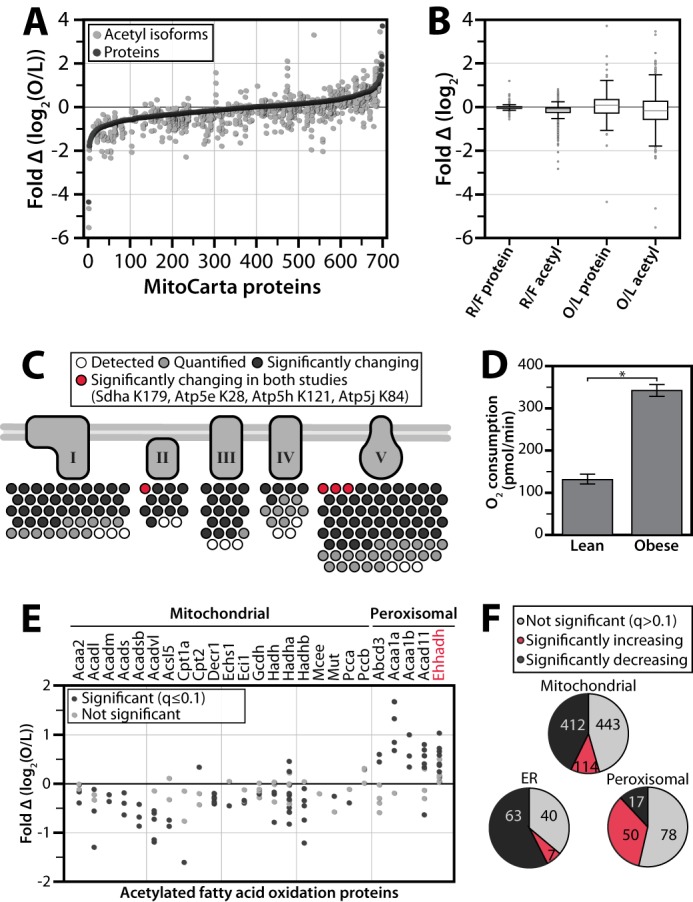
FIGURE 3.

Comparison of of acetylproteome response to acute and chronic perturbations. A, all quantified MitoCarta proteins are ranked on the x axis by protein abundance fold change (black dots) for the chronic comparison of obese (O) and lean (L) mice. Relative acetyl isoform changes are plotted in the same position on the x axis as the corresponding protein measurement (gray dots). B, dynamic ranges of protein and acetyl abundance are greater in obese/lean study than in refed/fasted (R/F) study. A box plot comparing the ranges of protein abundance and acetyl isoform fold change in the acute (refed/fasted) study versus the chronic (obese/lean) study. Whiskers represent data within 50% of the range of the first and third quartiles, and remaining outlier data is represented as a gray dots. C, prioritization of acetylation sites in oxidative phosphorylation. Acetyl isoforms exhibiting significant changes (q ≤ 0.1) in both studies are in red; those significantly changing in the obese versus lean study only are in black; those isoforms that are not changing significantly are in gray; isoforms that were identified but not quantified are in white. D, ADP stimulated increase in oxygen consumption rate is greater in mitochondria isolated from obese livers than from lean livers. An asterisk indicates significance (p value = 3.9 × 10⁻¹⁴). E, relative acetyl occupancy changes in fatty acid oxidation. Sites with significantly changing (q ≤ 0.1) occupancy are marked in black, those that were quantified but not significantly changing in gray, and those that colocalize to peroxisomes are grouped. F, acetylation by organelle. Pie charts show the number of mitochondrial, peroxisomal, or endoplasmic reticular acetyl isoforms from the obese/lean study that are not significant (q > 0.1) (gray), significantly increasing (red), and significantly decreasing (black).
