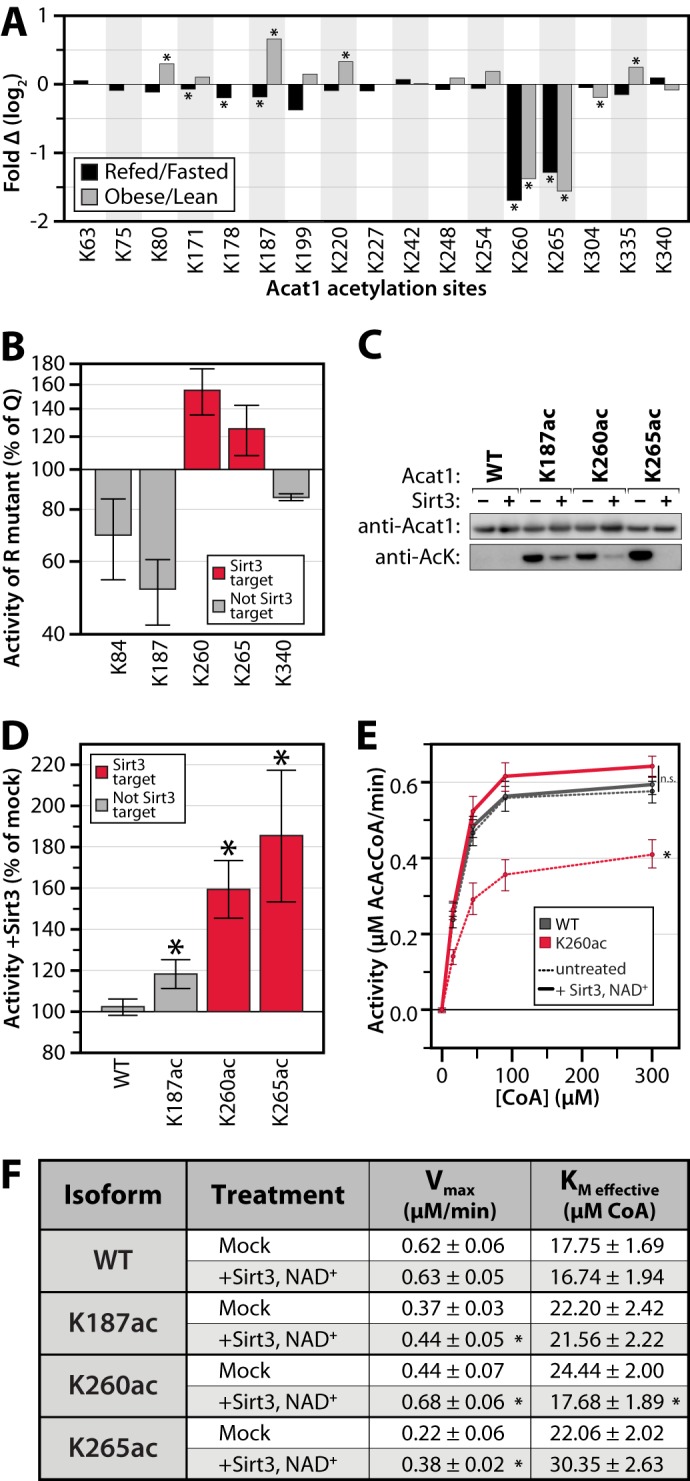
FIGURE 5.

Reversible, Sirt3-regulated acetylation of Acat1 Lys-260 inhibits activity. A, relative acetyl occupancy fold change for 17 quantified sites on Acat1. An asterisk indicates q ≤ 0.1. B, in vitro enzyme activity assays of Acat1 mutants generated by mutating lysine to glutamine (Q, acetyl mimic) or arginine (R, deacetyl mimic). Data are expressed as the average activity of the Arg mutant as a percentage of that for the Gln mutant, at 300 μm CoA (± S.E., n ≥ 2). C, immunoblot for Acat1 and acetyllysine on samples of purified Acat1 protein used in kinetic assays. Proteins were treated with or without NAD+ and Sirt3. AcK, acetyllysine. C, representative of samples used in D. D–F, in vitro enzyme activity assays of Acat1 with site-specific incorporation of acetyllysine at the indicated residues, with or without deacetylase (Sirt3) treatment. D, data are expressed as the average activity after Sirt3 treatment as a percent of mock-treated enzyme, at 300 μm CoA (± S.E., n ≥ 3; an asterisk indicates a significant difference from mock treatment, p < 0.05). E, aggregated enzyme kinetic analysis (n = 4; an asterisk indicates a significant difference from all other treatments, p < 0.05; n.s. indicates no significant difference between the highlighted treatments). F, table of kinetic parameters of Acat1 isoforms ± Sirt3 treatment (± S.E., n ≥ 3; an asterisk indicates a significant difference from mock treatment, p < 0.05).
