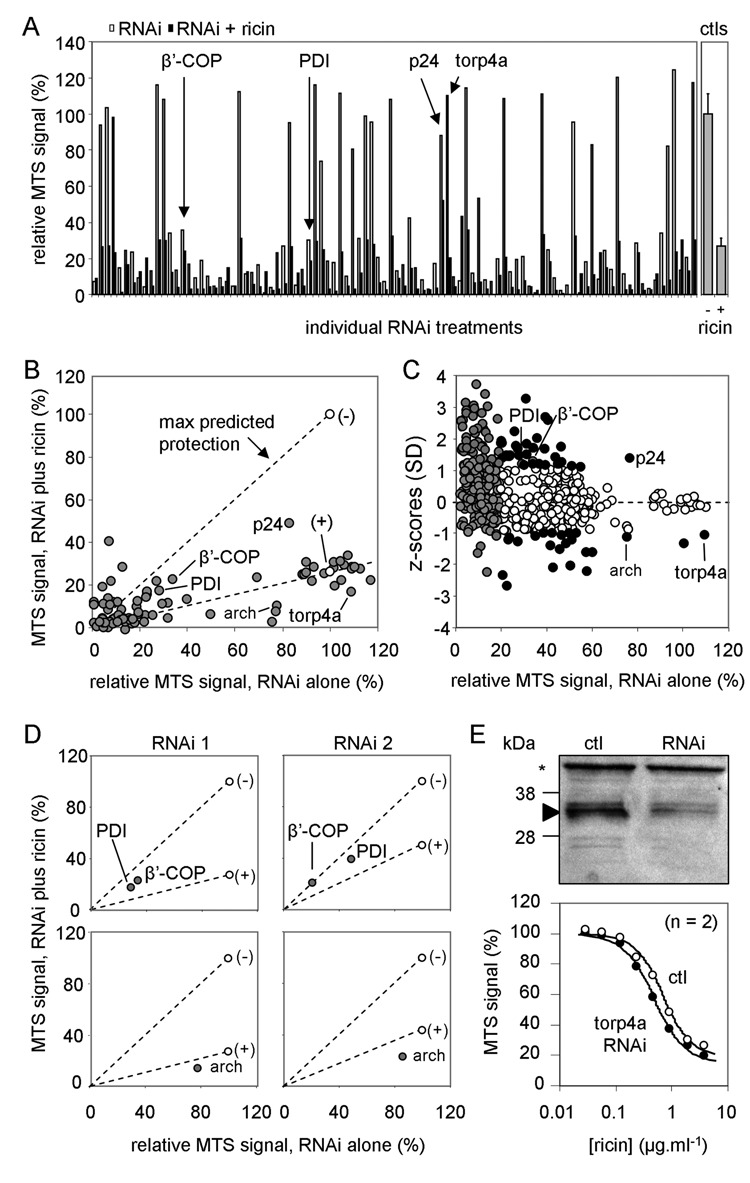
Fig. 4.

Screening results. (A) Left panel: MTS signals from initial screening of 96 RNAi treatments are displayed as pairs of bars (white, RNAi treatment alone; black, RNAi treatment with subsequent ricin challenge). A number of candidate hits are highlighted (arrows). Right panel: Corresponding ricin-treated controls (no RNAi treatment). (B) Signals from A plotted in scatter format, defining the sectors into which protective and sensitizing hits are likely to fall. (–), cells alone; (+), cells treated with ricin. (C) Standard z scores plotted versus relative growth of RNAi-treated cells for all 768 RNAi treatments tested. Gray circles: treatments rejected because the RNAi signal alone was 25% or less that of non-RNAi-treated cells. White circles: treatments rejected that lie within 1 SD from the mean value. Black circles: 45 remaining candidate treatments that may influence ricin cytotoxicity. (D) Testing alternative RNAi treatments: upper panels, RNAi treatments against PDI and β′-COP taken from B (RNAi 1, left) and from different RNAi treatments targeted against the same genes (RNAi 2, right); lower panels, RNAi 1 (left panel) from B against archipelago (arch) and an alternative RNAi 2 against the same gene (right panel). (E) Upper panel: Cell extracts (10 µg) of S2 cells treated or not (ctl) with torp4a RNAi were electrophoresed, immunoblotted, and probed for torp4a protein. *, cross-reacting protein. Approximate migration of size markers is shown on the left. Lower graph: S2 cells treated or not with torp4a RNAi were subsequently treated with ricin, and viabilities were determined by the MTS assay.
