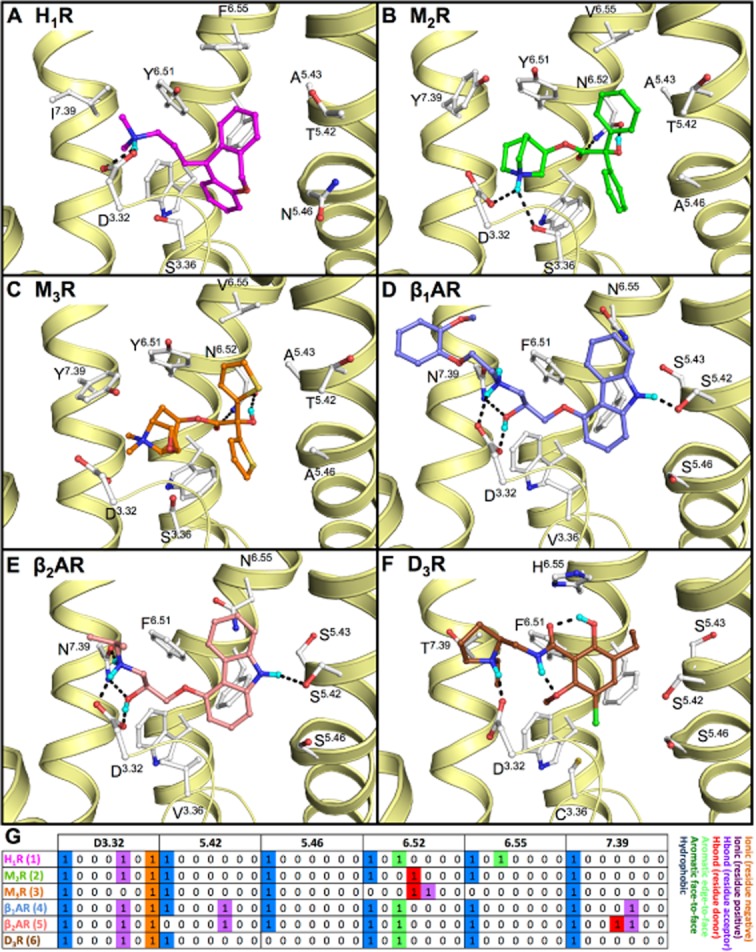
Figure 2.

Binding mode of (A) doxepin (1, magenta carbon atoms) in human H1R (PDB code 3RZE (Shimamura et al., 2011)), (B) (R)-3-quinuclidinylbenzilate (2, green carbon atoms) in human M2R (PDB code 3UON (Haga et al., 2012)), (C) tiotropium (3, orange carbon atoms) in rat M3R (PDB code 4DAJ (Kruse et al., 2012)), (D) (S)-carvedilol (4, blue carbon atoms) in turkey β1AR (PDB code 4AMJ (Warne et al., 2012)), (E) (S)-carazolol (5, red carbon atoms) in human β2AR (PDB code 2RH1 (Cherezov et al., 2007)) and (F) (S)-eticlopride [(6, brown carbon atoms in D3R (PDB code 3PBL (Chien et al., 2010)]. The yellow ribbons represent parts of the backbone of transmembrane (TM) helices 2, 3, 5, 6 and 7. Selected binding site residues are depicted as ball-and-sticks with light grey carbon atoms. Oxygen, nitrogen, sulphur, hydrogen and chlorine atoms are coloured red, blue, yellow, cyan and green, respectively. Hydrogen bonds are depicted by black dashes. Polar hydrogen atoms of the ligand are shown, but are omitted for the pocket residues. The labels for W6.48 are omitted for all structures as well as F6.52 for H1R, β1AR, β2AR and D3R for clarity purposes. (G) Molecular interaction fingerprint (IFP) (Marcou and Rognan, 2007) bitstrings describing the binding poses of 1–6 (A–F), encoding different interaction types (negatively charged, positively charged, H-bond acceptor, H-bond donor, aromatic face-to-edge, aromatic-face-to-face and hydrophobic) for each residue in the binding site. For reasons of clarity, only the bit strings of residues D3.32, 5.42, 5.46, 6.52, 6.55, and 7.39 are shown. All binding modes are presented in a similar fashion throughout the manuscript. 2D structures of the molecules are presented in Figure 3A.
