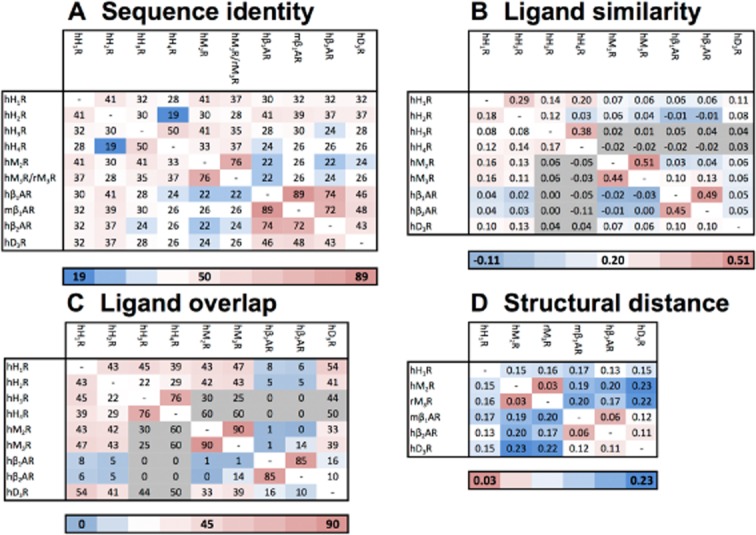
Figure 6.

(A) The percentage (%) of the pairwise sequence identity between the ligand binding pockets (i.e. the selected 55 residues) of the histamine receptors as well as the aminergic receptors with a crystal structure available. The percentage (%) of the pairwise sequence identity for the TM helices is described in Supporting Information Table S3. (B) The average ligand similarity as calculated by EDprints (Kooistra et al., 2010) by comparing ligands from the ChEMBL database for each of the histamine receptors as well as the aminergic receptors with a crystal structure available (the scores are based on the average of the highest similarity scores). (C) The ligand overlap by comparing 9903 ligands from the ChEMBL database with annotated affinity for one or more of the discussed aminergic receptors (expressed as a percentage of the total number of ligands with experimentally determined binding affinity, i.e. if the experimentally determined radioligand displacement Ki or IC50 value is 10 μM or lower, for one or both receptors). (D) The structural distance between the ligand binding pockets as calculated by SiteAlign (Schalon et al., 2008) (i.e. the selected 54 residues using distance-3) for the crystallized aminergic GPCRs. The gradient from blue to white to red indicates a low to high similarity of sequences (A), similarity of ligands (B), ligand overlap (C) and similarity of structures (D) respectively. One has to be warned for the values with a grey colour (B, C) as this indicates a low number of ligands available for this analysis (n < 45) therefore they might be misleading.
