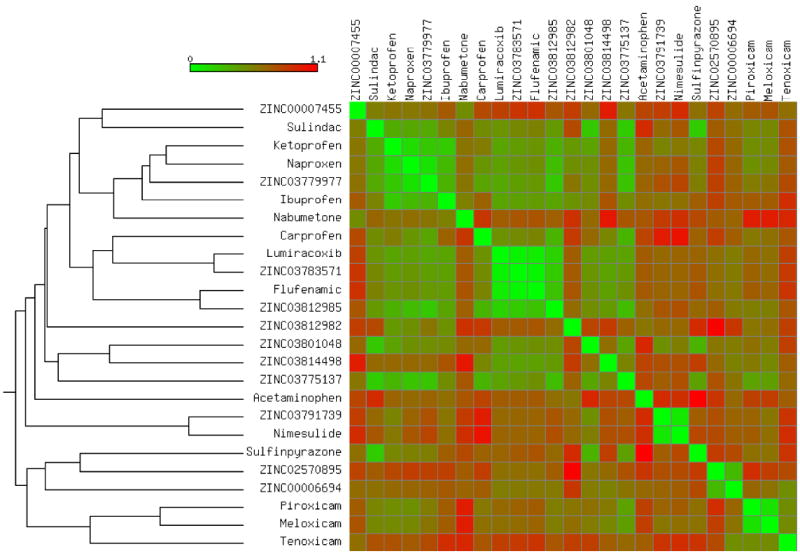
Figure 2.

Tree based on the pairwise Tanimoto-fingerprint distances between the 25 COX inhibitors tested in the present study. The heat map highlights the distances calculated in the first 5 principal components space (% variance explained > 90%) originating from 10 physico-chemical descriptors (i.e. net charge, MW, LogP, LogS, HBD, HBA, PSA, no. of atoms, no. of rings and no. of rotatable bonds).
