Table 2.
SAR exploration around 15ca
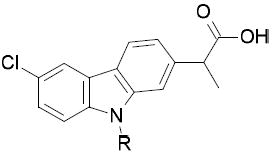
| ||||
|---|---|---|---|---|
| Compd | R | IC50 (μM)
± SDb
|
||
| FAAH | COX-1 | COX-2 | ||
| 15c |
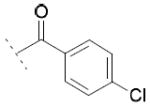
|
22.0±4.2 | 74.3±28.0 | 72.3±28.0 |
| 15d |
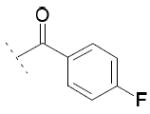
|
30.9±10.6 | / | / |
| 15e |

|
10.6±2.6 | / | / |
| 15f |
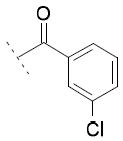
|
20.1±2.6 | / | / |
| 15g |
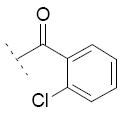
|
59.6±15.5 | / | / |
| 15h |
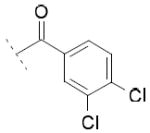
|
/ | / | / |
| 15i |
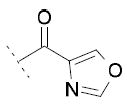
|
84.8±10.6 | 30.0±12.1 | 27.8±9.7 |
| 15j |
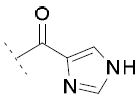
|
5.6±2.9 | 12.8±8.9 | / |
| 15k |
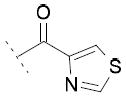
|
/ | / | / |
Values are means of ≥3 experiments performed in duplicate;
/ : IC50 >100μM
