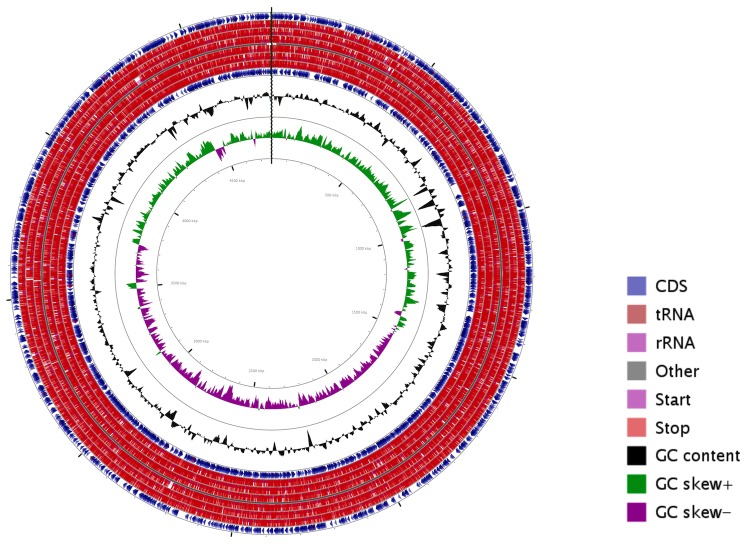
Figure 2.
Circular map of the Salmonella enterica serovar Typhi P-stx-12 chromosome. From the inside to outside, the first and second circles show GC skew and G+C content respectively. The third circle shows the CDS, tRNA and rRNA in the reverse strand; the fourth circle shows the CDS, tRNA, rRNA in the forward strand. This figure was generated by CGView [45].

