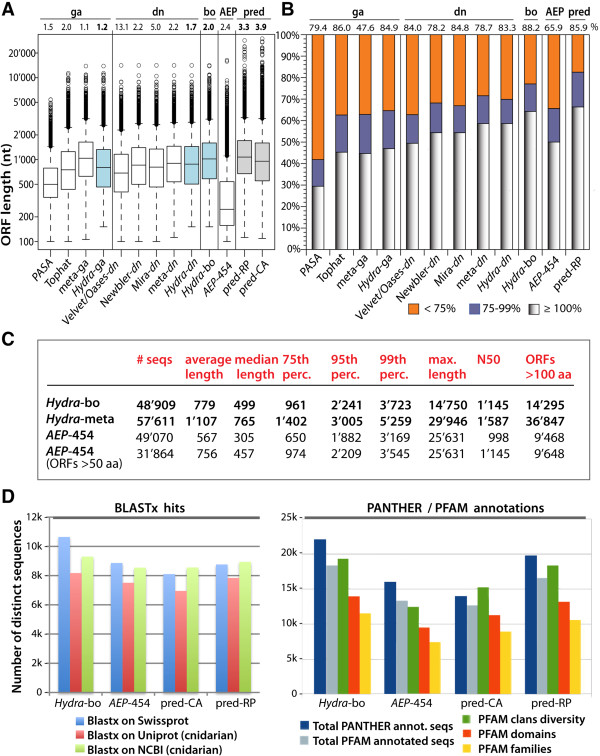
Figure 5.
Comparative analysis of the Hydra vulgaris (Illumina-454 RNAseq), Hydra AEP (454 RNAseq) and Hydra magnipapillata (genome-predicted) transcriptomes. A) Boxplot representing the ORF lengths (nucleotides) of the intermediary (white) and final (blue) assemblies of the genome-assisted (Hydra-dn) and “best of” (Hydra-bo) transcriptomes. For comparison see the distribution of ORF lengths from the AEP-454 (white) [11] and predicted (pred-RP, pred-CA, grey) [3] transcriptomes. Open circles represent outliers. Horizontal bars represent, from bottom to top, minimum, lower quartile, median, upper quartile, and maximum ORF lengths (excluding outliers). Numbers at the top indicate redundancy indexes. B) Comparison of the sizes of the coding sequences between the datasets shown in A and the pred-CA transcriptome. The pred-CA coding sequences were aligned against each sequence of every other dataset using BlastN+ without low complexity filter. First hits were retained if the alignment was uninterrupted for more than 100 nt with at least 95% sequence identity. The sizes of the matched and queried sequences were compared and classified into three classes according to the size of the tested sequence (hit): ≥ 100% if larger or equal to the size of the corresponding pred-CA sequence (greyish shadow), between 99% and 75% (blue), lower than 75% (orange). Top numbers indicate the percentage of pred-CA sequences matched by the transcriptome indicated on the x-axis. C) Characteristics of the Hydra-bo, Hydra-meta and AEP-454 RNAseq transcriptomes. As Hydra-bo and Hydra-meta contain exclusively sequences that are at least 150 coding nucleotides long, the same criteria was applied to the AEP-454 dataset. The last column indicates the number of full-length (start and stop codons) ORFs longer than 100 AAs. D) Number of functionally annotated sequences in the RNAseq and genome-predicted transcriptomes when analyzed with BlastX+ (left), Pfam or Panther (right).

