Figure 6.
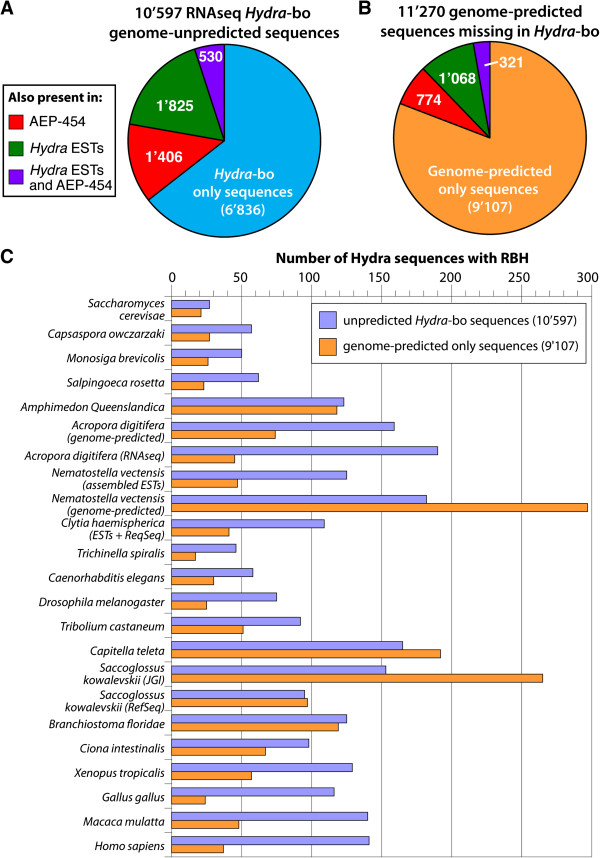
Comparative analysis of the RNAseq only and predicted-only sequences. A) Pie chart showing the distribution of the 10’597 Hydra-bo sequences not found in the genome-predicted transcriptomes, thus named “unpredicted”: 3’761 align to Hydra ESTs and/or to sequences from the AEP-454 transcriptome whereas 6’836 appear novel. B) Pie chart showing the distribution of the 11’270 genome-predicted sequences that were not found in the Hydra-bo dataset: 2’163 align to Hydra ESTs and/or to AEP-454 sequences but 9’107 sequences do not align to any expressed transcripts, thus named “predicted-only”. C) Number of Reciprocal Best Hits (RBHs) identified among predicted-only (9’107) and unpredicted (10’597) sequences when tested on a variety of opisthokont species. RBHs occurrence was assessed for Hydra-bo and predicted transcriptomes in each species individually, using whole proteomes and whole deduced proteomes. Predicted-only and unpredicted sequences corresponding to RBH orthologs were then extracted.

