
Figure 1. An example of how 3D geometry is used to evaluate pattern formation in Drosophila.
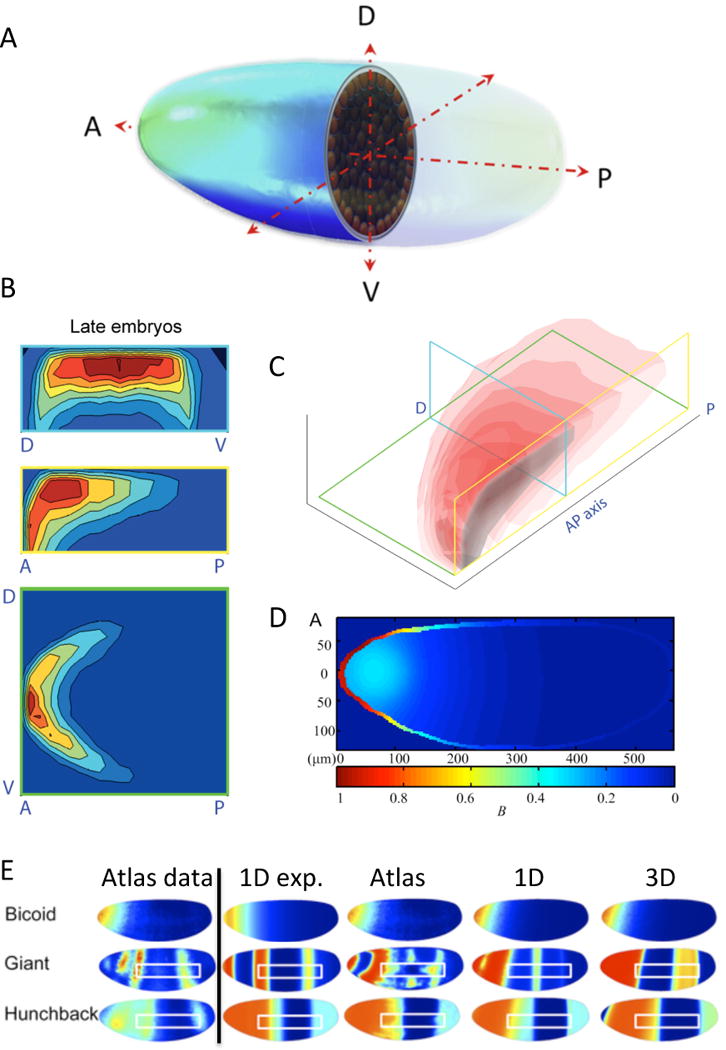
(A) Rendering of Drosophila blastoderm embryo (from Umulis et al. 2010, with permission). (B) bcd mRNA density map (from Little et al. 2011, with permission). Top: transverse; Middle: coronal; and Bottom: Midsaggital planes (planes shown at right in C). (C) isosurfaces for bcd mRNA density. (D) 3D model results for Bcd transport (from He et al., 2010). (E) 3D model results for gap gene system with different types of Bicoid input. Atlas data is shown in left column (reproduced with permission, PLoS ONE; Hengenius et al. 2011) Model results are shown at right for different types of Bcd input including exponential (1D exp.), direct data input from atlas (Atlas), and a Bcd SDD model optimized in 1D and 3D.