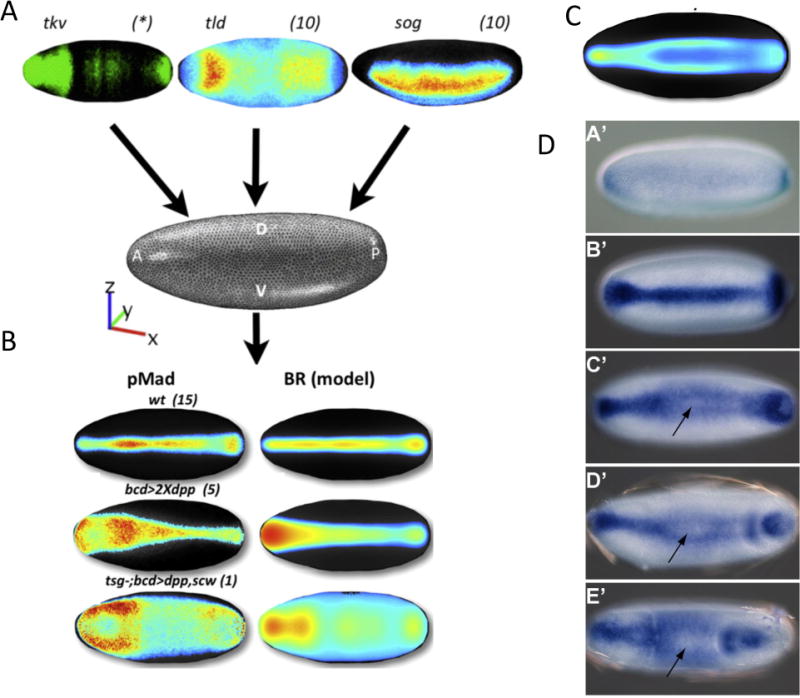
Figure 2. Model development and testing for BMP-mediated dorsal surface patterning.

(A) A schematic of the data integration methodology. (Umulis et al., 2010; Dev. Cell, with permission.) (B) An example of model success for wild type and failure (ectopic overexpression). Notice the peak loss, or peak splitting behavior in the data. (C) An example model result that exhibits peak splitting along the dorsal surface of the embryo. (D) Dynamics of M. abdita BMP patterning (Rafiqi et al., 2012). Dynamic evolutions from early (A’) to late (E’) blastoderm embryo. Arrow indicates position of trough between peaks after the pMad distribution splits.
