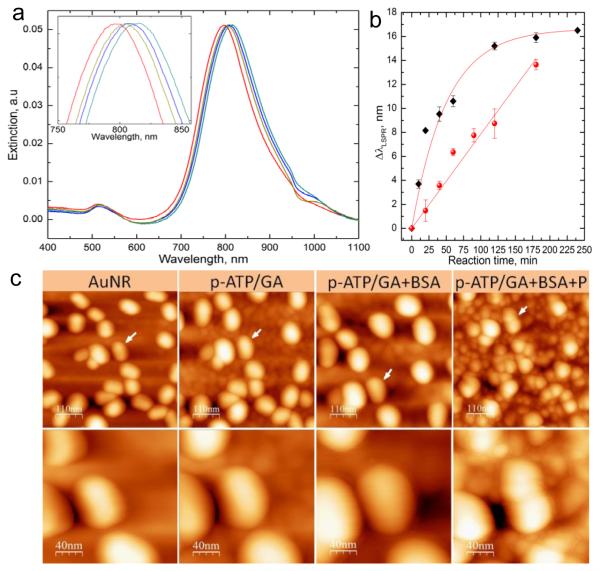
Figure 2.
Structural characterization of the protein imprinting procedure. a) Extinction spectra of the AuNR following each step. b) Plot depicting the shift in the LSPR wavelength as a function of the reaction time of p-ATP/GA (black squares) and siloxane co-polymerization (red circles). c) AFM images after treatment with the cross-linker (p-ATP/GA), immobilization of the protein (BSA) and co-polymerization of the siloxanes (P). The white arrows indicate the same nanorods after each step. Higher magnification AFM images are shown in the second row.

