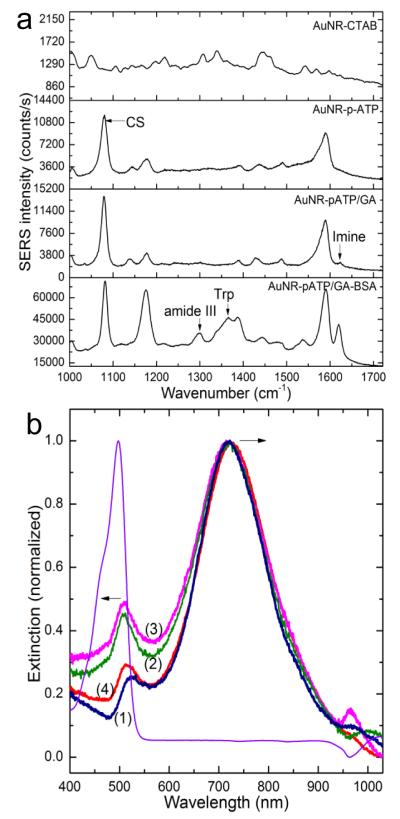
Figure 3.
Characterization of protein immobilization and release. a) Surface enhanced Raman scattering spectra obtained from the AuNR at each step of the imprinting process. b) Normalized extinction spectra of fluorescein-conjugated BSA (f-BSA) at 498 nm (purple) and AuNR before (1) and after immobilization of the template f-BSA (2), followed by a treatment with oxalic acid (3) or a mixture of oxalic acid and SDS (4) to release the template. The black arrows indicate the shift in opposite direction of the longitudinal (720 nm) and transverse (523 nm) plasmon bands. The exposure of the AuNRs to BSA solution results in a red shift of the longitudinal band by 5 nm as expected, while the transverse band undergoes an apparent blue shift by 10 nm. The apparent blue-shift is due to the effect of fluorophore absorption band localized at slightly lower wavelength.

