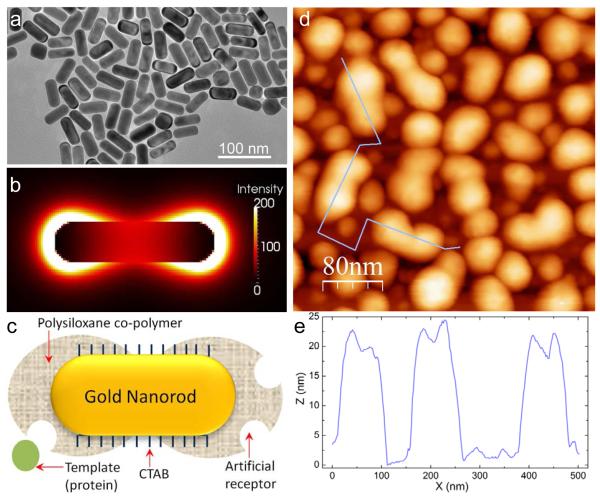
Figure 4.
Hot spot-localized imprinting of AuNRs. a) Representative TEM image of AuNR. b) Cross-sectional view of the electric field distribution around AuNR at the extinction maximum of the longitudinal band (724 nm in Fig. 2e). The image is obtained by finite-difference time-domain (FDTD) modeling. c) Scheme showing the preferential growth of the siloxane co-polymer at the nanorods ends where the capping ligand (CTAB) is sparse. Figures b and c show the spatial matching of the imprinted area with the localization of the plasmonic hot-spots. d) AFM image (scan size 400 nm × 400 nm) depicting the peanut-shaped MIP-AuNRs, corresponding to the scheme in Fig. c. The violet line indicates the localization the height profile represented in Fig. e. We can see that MIP-AuNR thickness id 3-5 nm higher at the ends than in the center of the nanorods.

