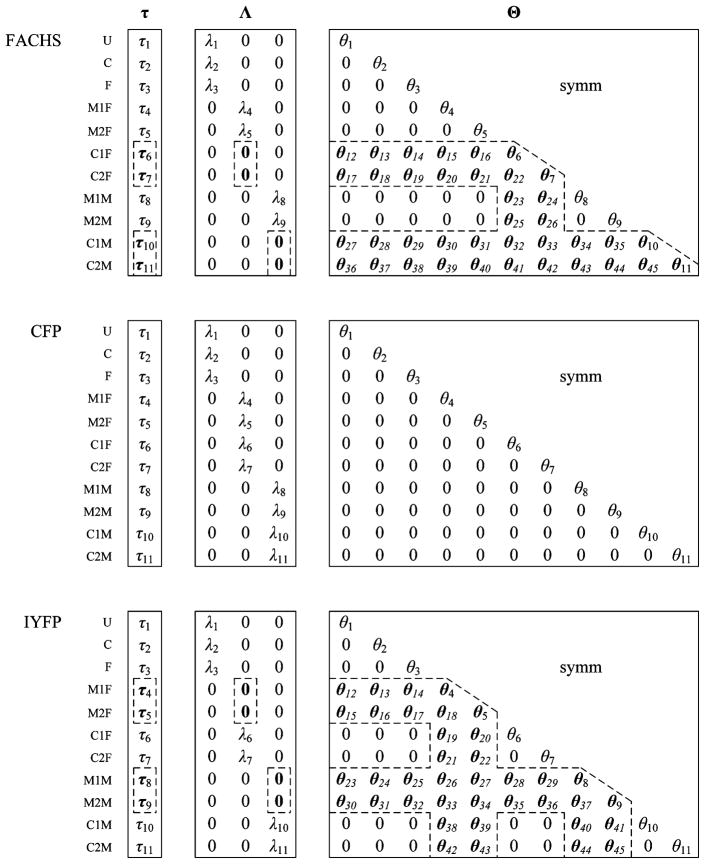
FIGURE 2.
Schematic representation of the intercept vector τ, factor loading matrix Λ, and unique factor covariance matrix Θ for the Family and Community Health Study (FACHS), California Families Project (CFP), and Iowa Youth and Families Project (IYFP) studies. Note. U = unmet material needs; C = can’t make ends meet; F = financial cutbacks; M1F and M2F = Mini-MASQ Parcels 1 and 2 father report, respectively; C1F and C2F = CES–D Parcels 1 and 2 father report, respectively; M1M and M2M = Mini-MASQ Parcels 1 and 2 mother report, respectively; and C1M and C2M = CES–D Parcels 1 and 2 mother report, respectively.

