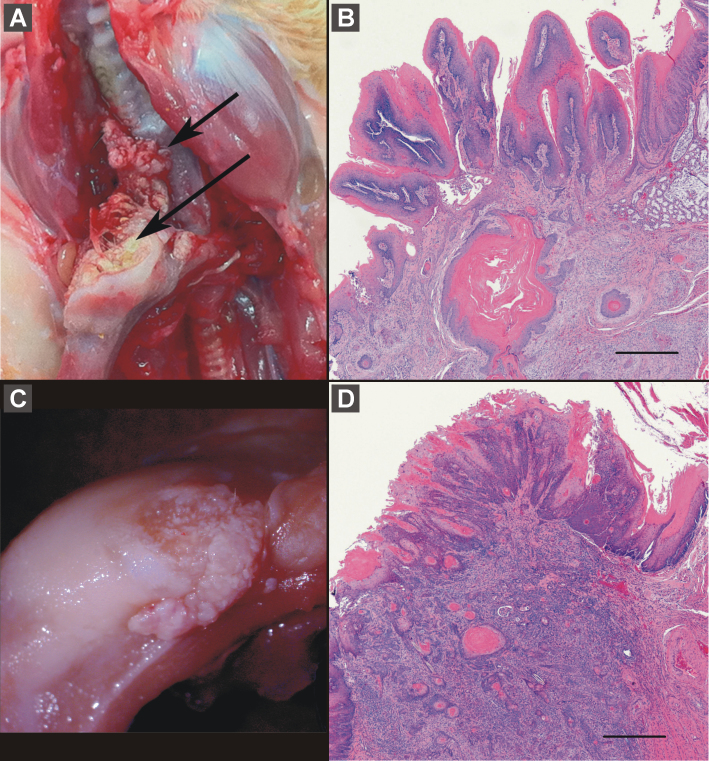
Fig. 3.
Squamous cell carcinoma in animals treated with (S)-NNN. Plate A shows squamous cell carcinomas involving both the soft palate (short arrow) and tongue (long arrow); corresponding histology showing invasion of soft palate is shown in plate B (bar = 500 µm). Plate C shows another squamous cell carcinoma involving the tongue, and corresponding histology showing invasion of underlying skeletal muscle is shown in plate D (bar = 500 µm).

