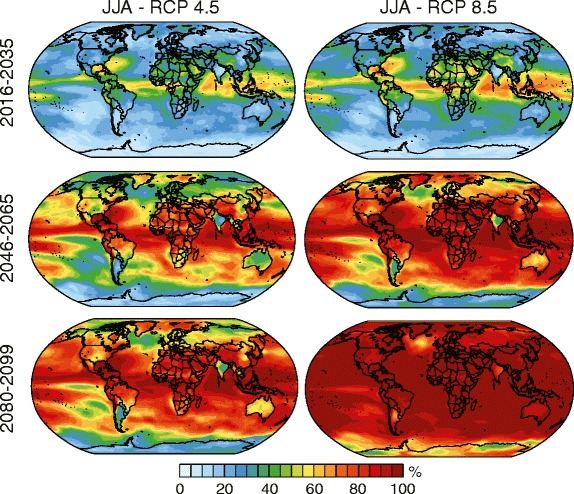
Fig. 3.

The occurrence of the 1986–2005 maximum June-July-August (JJA) seasonal temperature in the 2016–2035, 2046–2065 and 2080–2099 periods of RCP8.5 (left) and RCP4.5 (right). The panels show the absolute occurrences as the percent of years in each 20-year period. The frequency of occurrence of the 1986–2005 maximum JJA seasonal temperature value is, by definition, 5 % at each grid point during the 20-year 1986–2005 period
