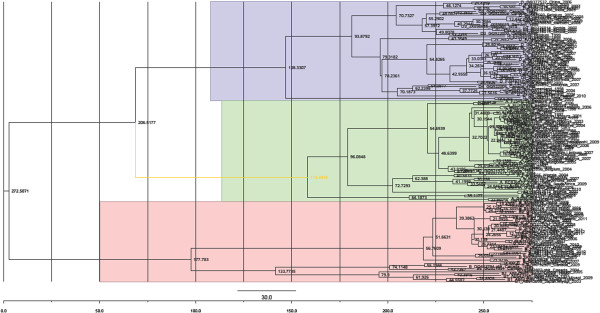
Figure 1.
The maximum clade credibility (MCC) tree was estimated using Bayesian analysis with HBcAg gene sequences about ~660 bp of HBV. The key nodes above the respective nodes were used to show the posterior probabilities. The green color depict genotype D (n = 54), and blue pink color display genotype A (n = 55) and B (n = 44).

