
Figure 2.
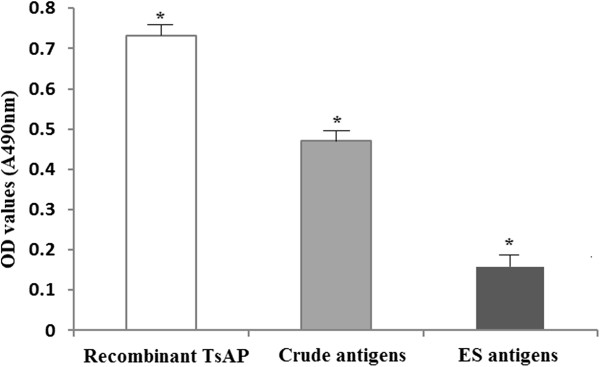
The specific IgG antibody levels of mice immunized with recombinant TsAP protein assayed by ELISA using different antigens. The optical density (OD) values shown for each group are the mean ± standard deviation (SD) of antibody levels (n = 13). Asterisks (*) indicate statistically significant differences (P < 0.01) in OD values of one kind of antigens compared to other two kinds of antigens.