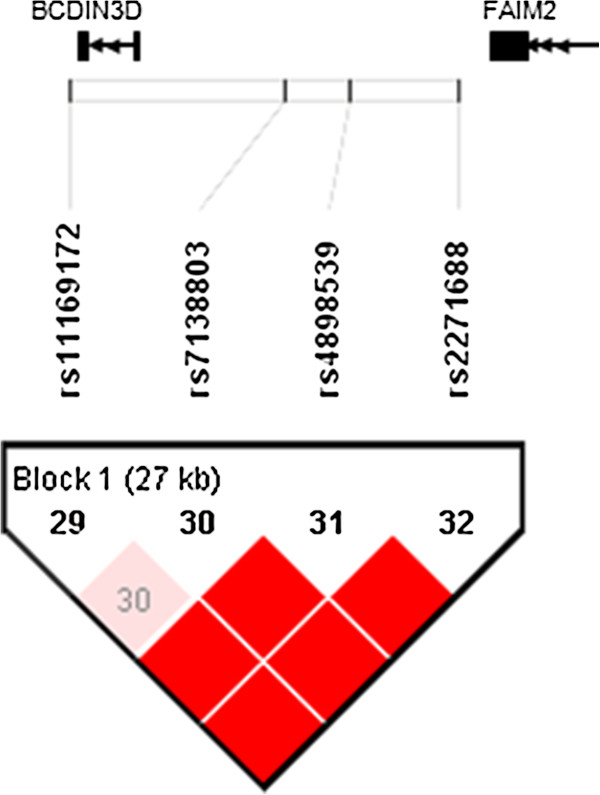
Figure 1.

Overview of linkage disequilibrium (LD) of the 40 kb region around rs7138803 of FAIM2/BCDIN3D. The LD structure around the SNP rs7138803 was derived from the genotyping data of the HapMap for the Chinese population (http://www.hapmap.org, phase 2, HapMap-HCB). The pairwise correlation between SNPs was measured as D’ and a red diamond without a number refers to D’ = 100. Exons are marked with black boxes. The direction of ZFHX3 transcriptions was to the left as marked by the arrows.
