Figure 5.

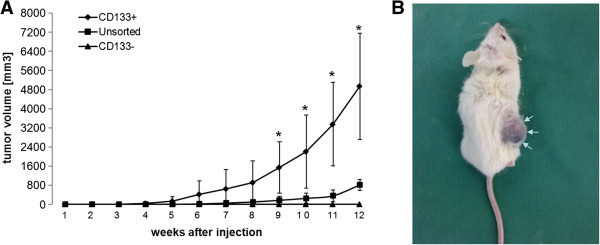
Tumorigenicity of D10 cells. A: The Change in tumor volume over a period of 12 weeks is shown in the graph. (*) = p ≤ 0.05. Bars represent SD. Tumor progression of CD133+ D10 cells significantly (p ≤ 0.05) differs from unsorted D10 tumors. B: Injection of CD133+ D10 cells into the right flank (R) leads to tumor formation (white arrows) while CD133- D10 cells are not capable of inducing tumor growth. Bilateral injection of unsorted D10 cells is followed by bilateral tumor formation.
