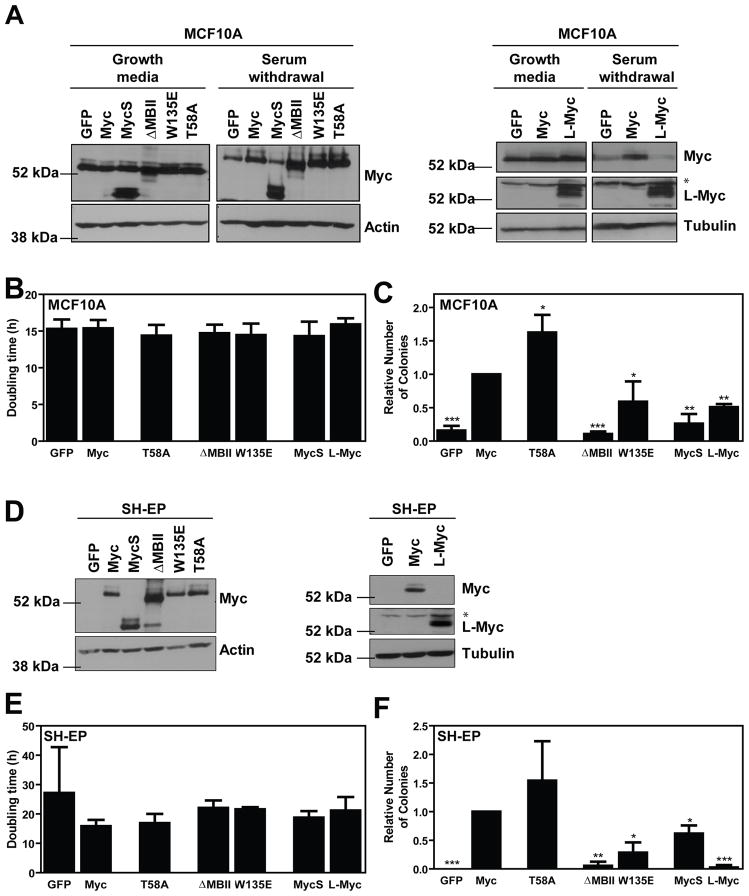
Figure 2. Transformation in MCF10A and SH-EP cells is MBII-dependent.
The panel of Myc cDNAs were introduced by infection with ecotropic, replication-incompetent retrovirus into MCF10A and SH-EP cells as described previously (Wu et al., 2004). For all SH-EP experiments, 1 μg/mL tetracycline (Sigma, St. Louis, MO) was added to the media 48 hours prior to experiments to inactivate N-Myc expression. A,D) Protein expression was evaluated by immunoblotting. MCF10A cells were harvested under both asynchronously growing and 1 hour serum and growth factor withdrawl conditions. * indicates non-specific bands. B,E) Cell proliferation was assessed by subconfluently seeding 4000 cells/well in a 24-well dish in triplicate. Cells were counted daily over a 5 day period using a Coulter Counter, or haemocytometer. Population doubling times were calculated using GraphPad Prism software (v2.0b) and are presented as mean ± standard deviation for 3–5 independent experiments. C,F) Soft agar experiments were completed as described in Figure 1. Transformation data is presented as a relative number of colonies compared to cells expressing wild-type Myc, with mean ± standard deviation for 3–6 independent experiments. *p<0.05, **p<0.01, ***p<0.001, paired t-test.

