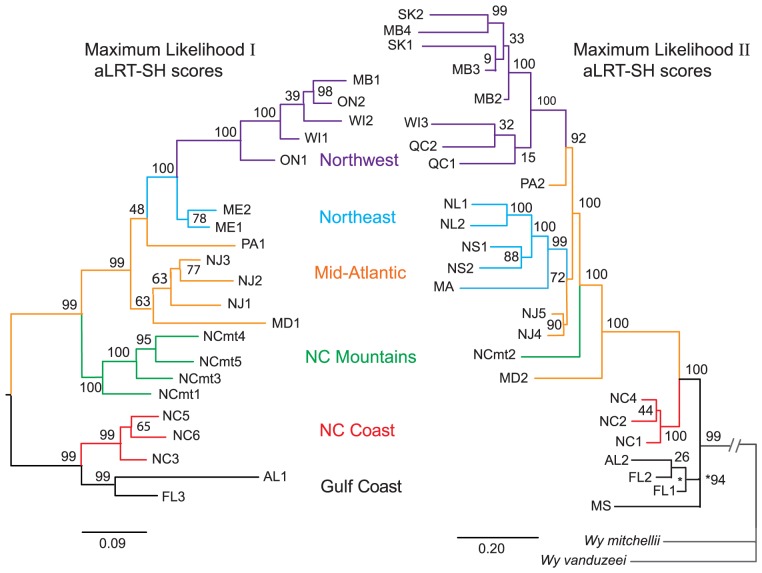
Figure 1. Replicability of maximum likelihood trees.
Left, phylogenetic tree from [1] using 21 populations and 54 bp reads Right, phylogenetic tree from the current study using 25 populations and 80 bp reads. Branches leading to W. mitchellii and W. vanduzeei are abbreviated to clarify presentation. Color code indicates region of geographic origin. Numbers show nodal support as aLRT-SH scores. Two-letter abbreviations identify each state or province. Where two or more sites come from the same state or province, they are identified by number. Latitudes, longitudes, altitudes, and acronyms connecting the specific localities with earlier studies from this lab are provided in Table S1. The scale bars indicate substitutions per site.

