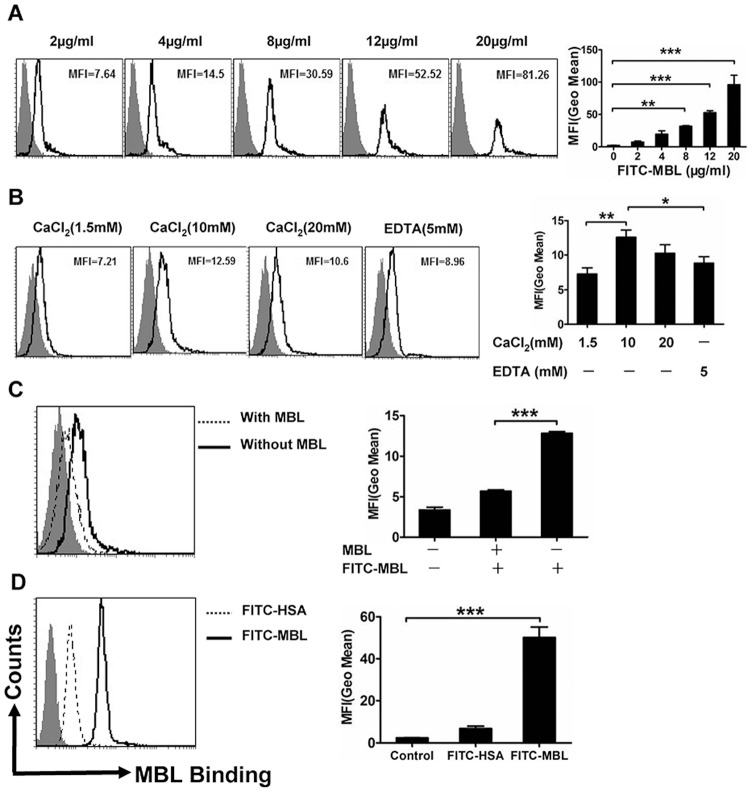
Figure 1. Analysis of binding of MBL to monocytes by FCM.
Monocytes were treated in vitro with various concentrations of FITC-MBL (A). The shaded curves describe cells only; the black solid line shows FITC-MBL. Ca2+-dependent binding of MBL to monocytes (B), where monocytes were pretreated in vitro with tris-buffer saline, and then treated with 4 μg/ml of FITC-MBL. (C) Shows that unlabelled-MBL attenuated the binding of FITC-MBL to monocytes. Monocytes were preincubated with (dotted line) or without (black solid line) unlabelled-MBL (200 μg/ml), and further incubated in vitro with 4 μg/ml of FITC-MBL. (D) Shows MBL binding to U937 cells, where U937 cells were treated with 10 μg/ml of FITC-human serum albumin (HSA) (dotted line) or 10 μg/ml of FITC-MBL (black solid line). These data are the representatives of three independent experiments. Each bar represents the mean ± S.D. Data were evaluated by one-way ANOVA and multiple comparisons were performed by Bonferroni or Dunnett T3's test. * P<0.05, ** P<0.01, *** p<0.001.

