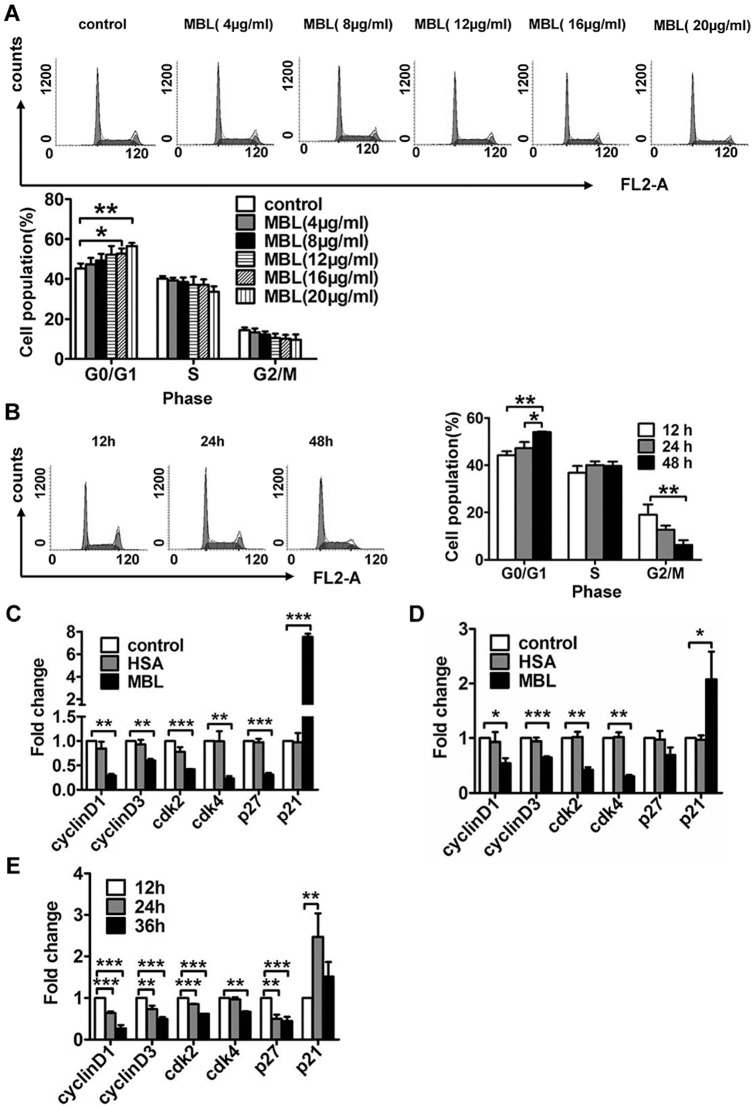
Figure 3. Regulation of monocyte cell cycle by MBL.
(A and B) Cell cycle distribution of U937 cells treated with MBL. FCM analysis of the cell cycle distribution induced by MBL for 24 h at the indicated concentrations (A) and by 8 μg/ml MBL for the indicated times (B). (C–E) The effect of MBL on the mRNA expression of cell cycle regulatory proteins was analyzed by real-time RT-PCR. (C) U937 cells, and (D) monocytes were treated with vehicle, HSA (20 μg/ml) and MBL (20 μg/ml) for 24 h. (E) U937 cells were treated with MBL (8 μg/ml) for different times as indicated. Each bar represents the mean ± S.D. of three independent experiments. * p<0.05, ** p<0.01, *** p <0.001 as compared with the control cultures.

