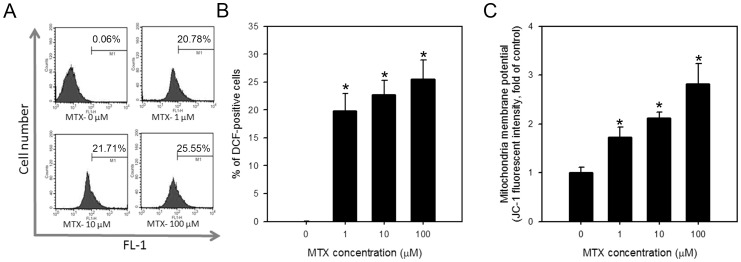
Figure 2. Generation of ROS and disruption of mitochondrial membrane potential in MTX-treated IEC-6 cells.
(A and B) Generation of ROS and (C) loss of mitochondrial membrane potential were examined by H2DCFDA and JC-1 dye, respectively, through flow cytometry after 24 hrs in cells treated with indicated concentration of MTX. Data were obtained from 10,000 events and presented as the percentage of cells positive for JC-1 monomer or DCF (green fluorescent). The representative histograms showing increment of FL-1 positive cells were given in (A). The values are shown as the mean ± S.D. of three independent experiments. *, p<0.05.

