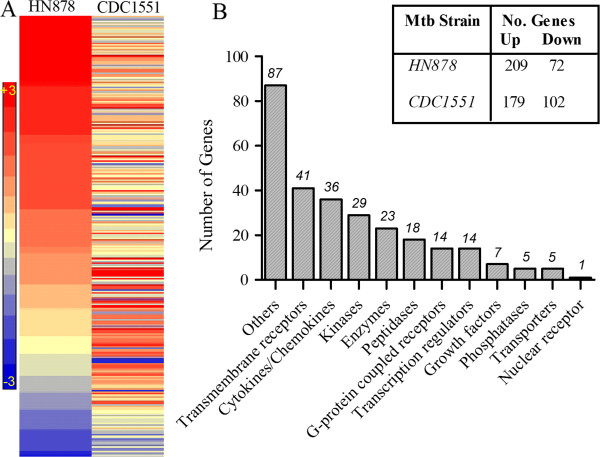
Figure 3.
Expression of inflammatory response network genes in Mtb-infected rabbit lungs. (A). Intensity plot of 281 SDEG involved in inflammatory response network in the HN878- or CDC1551-infected rabbit lungs at 3 hours. The color scale ranges from +3 (red; upregulation) to −3 (blue; downregulation) (B). Functional classification of inflammatory response network genes. Numbers on top of each bar refer to subsets of genes in each functional category. The top right table shows the number of up and down regulated SDEG by Mtb HN878 or CDC1551 infection of rabbit lungs at 3 hours.

