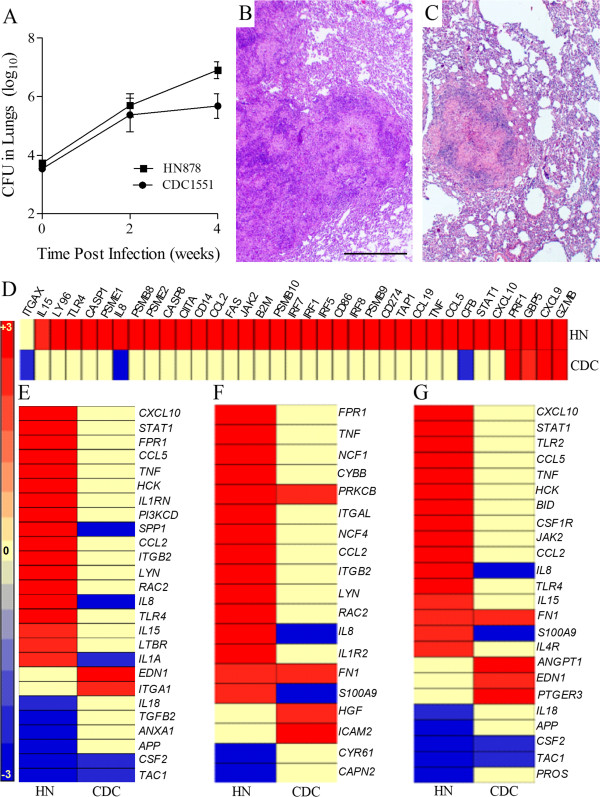
Figure 6.
Bacillary load, histology and expression pattern of selected network genes in Mtb-infected rabbit lungs at 4 weeks. (A) Total lung bacillary load in Mtb HN878- or CDC1551-infected rabbits at 4 weeks post-infection. The values plotted are mean ± standard deviation for 3–5 animals per time point. (B) Hematoxylin and Eosin (H&E) stained lung sections of Mtb HN878-infected rabbits at 4 weeks post-infection. (C) H&E stained lung sections of Mtb CDC1551-infected rabbits at 4 weeks post-infection. The scale bar (1 mm) is same for (B) and (C). (D-G) Intensity plots of STAT1 activation (D), macrophage activation (E), fMLP-stimulation (F) and PMN recruitment and activation network genes in the HN878- (HN) or CDC1551- (CDC) infected rabbit lungs at 4 weeks. For (D-G), the gene expression values were sorted in a descending fashion for the HN878 dataset. The color scale ranges from +3 (red) to −3 (blue).

