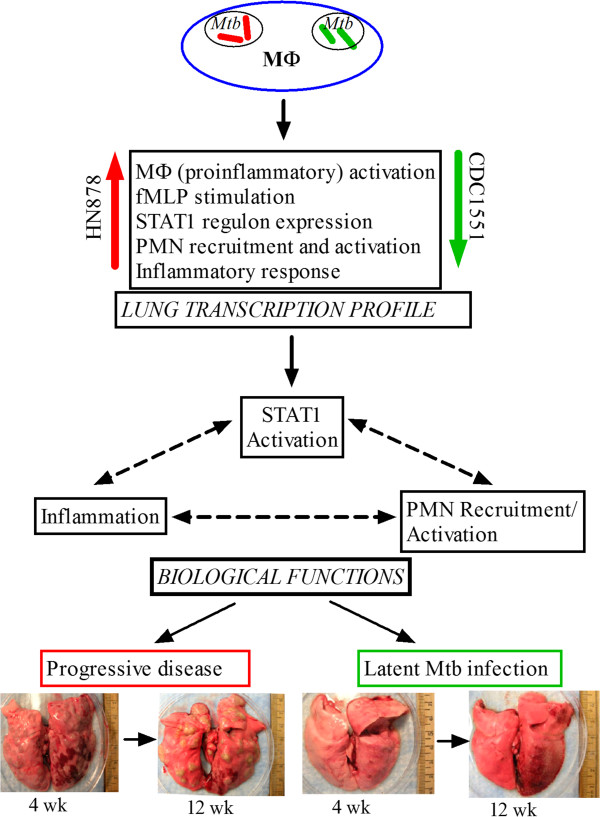
Figure 7.
Schematic illustration showing the interaction(s) among components of the early innate immune response at the transcriptional, cellular and organismal level during Mtb infection of rabbit lungs. Transcription profile refers to the microarray gene expression data from HN878- or CDC1551-infected rabbit lungs. The arrows in red (HN878) denote unregulation and those in green (CDC1551) indicate downregulation of pathway genes. Pathogenesis refers to the progression of infection into active disease (HN878) or containment of infection and establishment of latency (CDC1551) in the rabbit lungs at 4 to 12 weeks post-infection.

