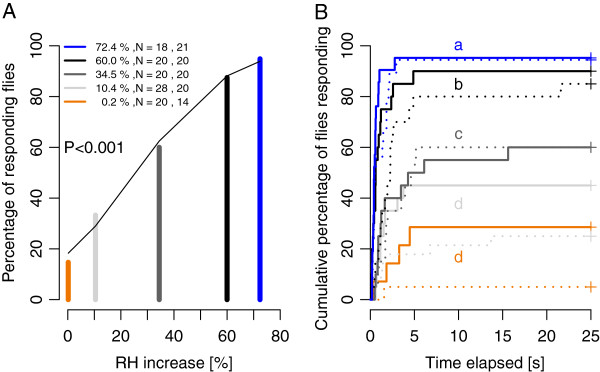
Figure 3.

Proportion of flies biting and response latency for increases in RH at a 13.1°C air temperature increase. A Proportion of flies that bite at least once. Line shows the predicted values from the GLM model. B Proportion of flies biting as a function of the response latency. Recording time was 120 s but only the first 25 s is presented as latency did not exceed this. Curves with different letters are significantly different. Solid lines are for males and dotted lines are for females.
