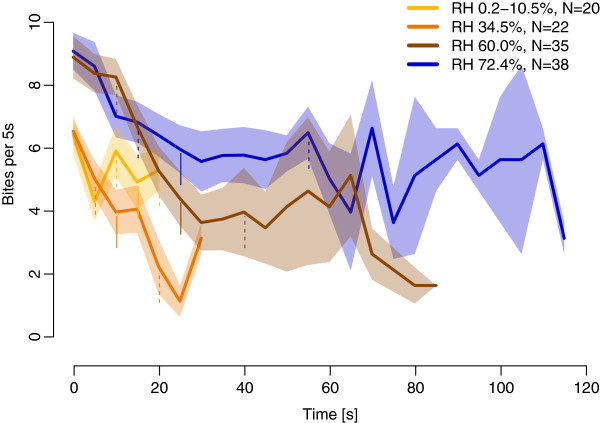
Figure 5.
Biting frequency dynamics over time for RH increments with a 13.1°C air temperature increase. The frequency was calculated for each RH increment (different colours) as the number of bites per 5 s and presented as the average biting frequency (bold lines) ± SEM (shaded areas). Time 0 is the onset of the first bite. All flies did not bite for 120 s so medians (vertical solid lines) for the time spent biting by flies are drawn for each RH increment; vertical dashed lines to the left of the median represent the first quartile and to the right the third quartile.

