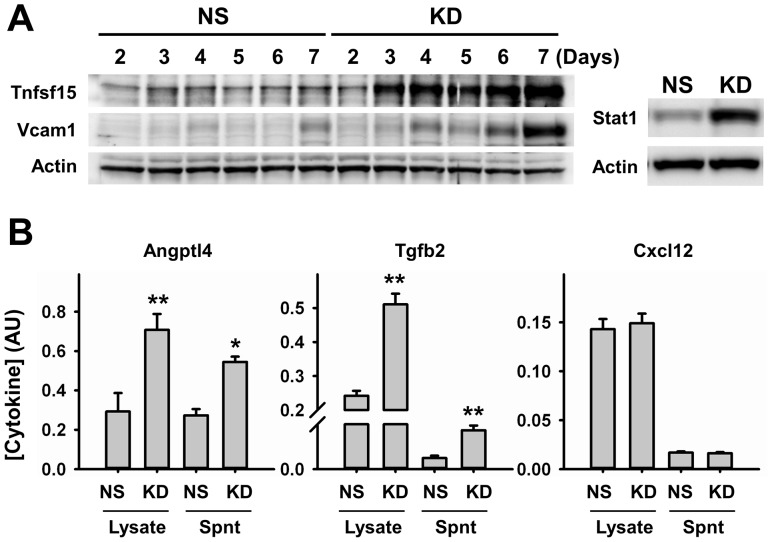
Figure 5. Protein Expression Analysis of Pro-Inflammatory Markers.
A. Representative western blot image showing time-dependent changes in the expression of Tnfsf15, Vcam1, and Stat1 after c-Myc knockdown. Expression of Stat1 was analyzed 6 days after knockdown. Actin was used as loading control (n = 4). B. Expression analysis of Angptl4, Tgfb2 and Cxcl12 in cell lysates and concentrated supernatants (Spnt) by ELISA 6 days after knockdown (n = 4). NS, control; KD, knockdown. *p<0.05, **p<0.005.

