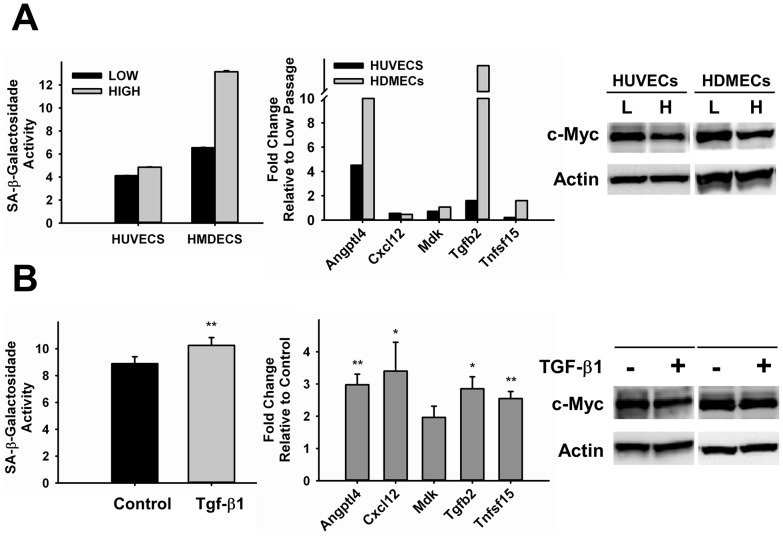
Figure 6. Analysis of c-Myc Expression in Endothelial Cells Undergoing Replicative- or Stress-Induced Senescence.
A. HUVECs and HMDECs at low (P6) and high (P12–11) passages. B. HUVECs treated with TGF-β1 for three days (n = 4–6). All samples were analyzed for SA-β-galactosidase activity (right panel), expression of pro-inflammatory markers genes (middle panel) and c-Myc expression by Western Blot (right panel). Actin was used as loading control. L = Low, H = High. *p<0.05, **p<0.005.

