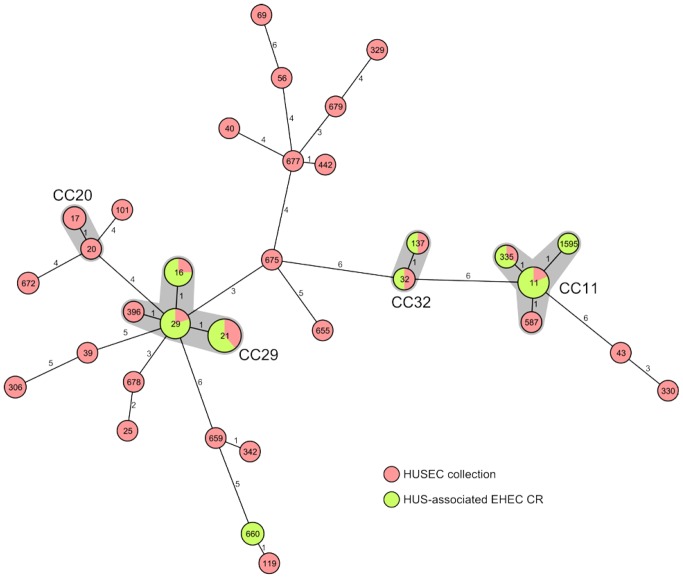
Figure 2. Phylogeny of EHEC associated with HUS in the Czech Republic.
Minimum-spanning tree illustrating the clonal relationship between HUS-associated EHEC from the Czech Republic (green) and the HUSEC collection [3] (red) based on MLST allelic profiles. Each MLST sequence type (ST) is represented by a node named with its ST. The size of the node is proportional to the number of isolates reported in this study sharing the same ST. The number on the connecting lines indicates the number of alleles that were different between the two connected nodes. In addition, for the major serogroups (e.g. O157, O26) the STs and their corresponding clonal complexes (CC) were given and shaded in grey.

