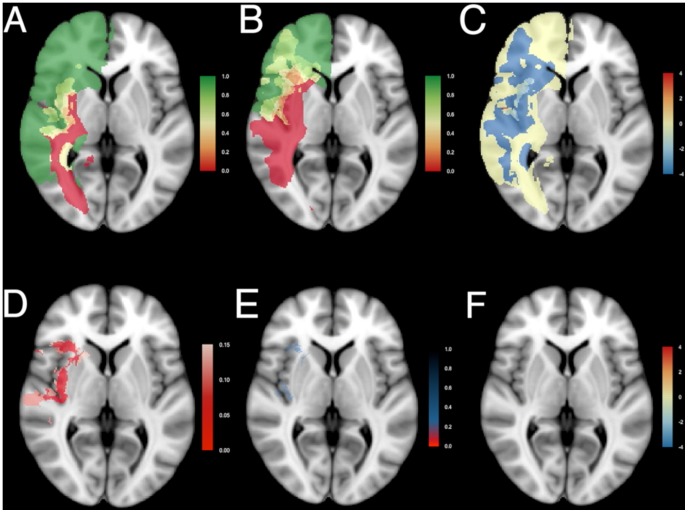
Figure 3. Resection probability maps for right-sided gliomas.
Results comparing (A) the junior surgical team, n = 29, and (B) the senior surgical team, n = 29, are shown superimposed on standard brain space (MNI152). A probability of 0 (red) represents locations where tumor was never resected, and a probability of 1 (green) represents locations where tumor was resected in all patients. An intermediate probability (yellow) represents locations where glioma was removed in a subset of patients. (C) Relative differences in probability of resection as log odds ratio. (D) The adjusted p-value map adjusted by the empirical null-distribution to address spatial dependency of voxels. Values less than 0.15 are plotted in shades of red. (E) The q-value map to address multiple testing. Values below 0.2 are plotted in shades of red, values between 0.2 and 0.8 in shades of blue. (F) Differences in probability of resection as log odds ratio for voxels with a q-value less than 0.2 demonstrate similar resection results between the two patient cohorts. Results are superimposed on a transversal section at z = 0 of MNI152. See Movie S2 for all transversal sections.

