
Figure 1.
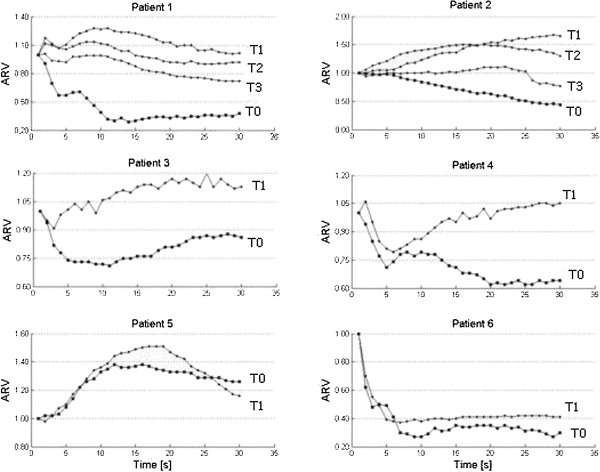
Normalized ARV values before and after the treatment. ARV = Average Rectified Value of EMG signal amplitude. On the x axis is represented Time (in seconds); on y axis is represented the ARV value. In the figure legend, T0 = before training; T1 = after 15 days of training; T2 = after 30 days of training; T3 = 15 days after suspension.