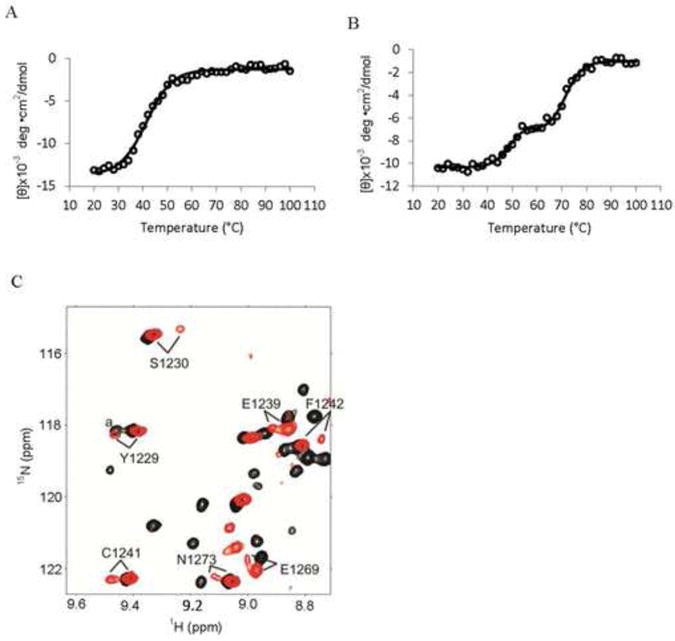
Fig. 2.

The BRD and the CH2 domain are more stable in BRD-CH2 than the isolated domains. Thermal denaturation of the BRD (A) and BRD-CH2 (B) measured by CD spectroscopy. The CD values measured at 208 nm are plotted against temperature ranging from 20°C to 100°C. Open circles are raw data while the solid lines show the fitted values using a sigmoidal curve. (C) An overlay of a selected region of the HSQC spectra of the isolated CH2 domain (red) and BRD-CH2 (black), showing residues observed as two peaks only in the spectrum of the CH2 domain. aThis peak in BRD-CH2 is from N1163.
