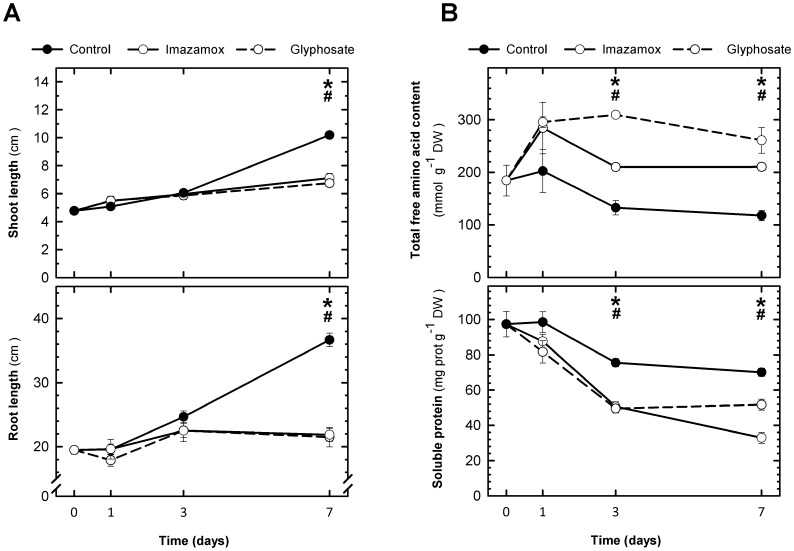
Figure 1. Effect of amino acid biosynthesis inhibitors on growth and amino acid and protein contents.
(A) Shoot and root growth of control pea plants and plants treated with imazamox or glyphosate. Means ± SE (n = 8). The symbols indicate significant differences between the control and imazamox (*) or glyphosate (#) treatment on a given day (p<0.05). (B) Total free amino acid and soluble protein contents in the roots of control pea plants and plants treated with imazamox or glyphosate. Means ± SE (n = 4–8). The symbols indicate significant differences between the control and imazamox (*) or glyphosate (#) treatment on a given day (p<0.05).

