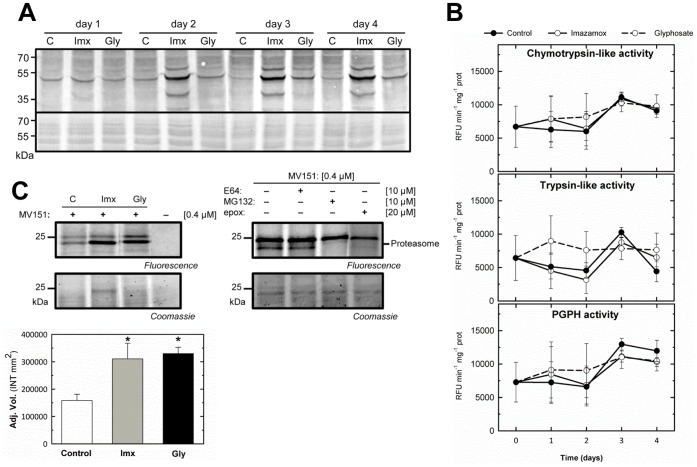
Figure 2. Effect of amino acid biosynthesis inhibitors on the proteasome.
(A) Ubiquitin immunoblotting of total protein extracts from control pea plants (C) or plants treated with imazamox (Imx) or glyphosate (Gly) for 1, 2, 3 and 4 days. A total of 30 µg of protein was loaded into each well. The Coomassie-stained protein gel on the bottom shows the total amounts of input proteins. (B) Chymotrypsin-like, trypsin-like and PGPH activities of the proteasome. These activities were measured using the specific substrates LLVY-AMC, GKR-AMC-HCl and LLE-AMC, respectively. The presented data correspond to the activities after subtracting the values obtained following incubation with the proteasome inhibitor MG132 for 30 min from those recorded without MG132. Means ± SE (n = 3). (C) ABPP of the proteasome. Left, a comparison of the labeling profiles observed in pea roots treated with imazamox or glyphosate at day 3 following incubation with 0.4 µM MV151 for 1 h at pH 7.5. Right, a competitive assay in which root extracts were pre-incubated with 10 µM E64, 10 µM MG132 or 20 µM epoxomicin for 30 min before labeling. The results of the competitive assay showed that the 25 kDa signal corresponded to the proteasome. Fluorescently labeled proteins were detected from protein gels via fluorescence scanning. The signals were quantified using a densitometer, and the results are shown in the bar graph. Means ± SE (n = 3). The symbol *indicates significant differences between the control and treatments (p<0.05). The Coomassie-stained protein gel on the bottom shows the total amount of input protein.

