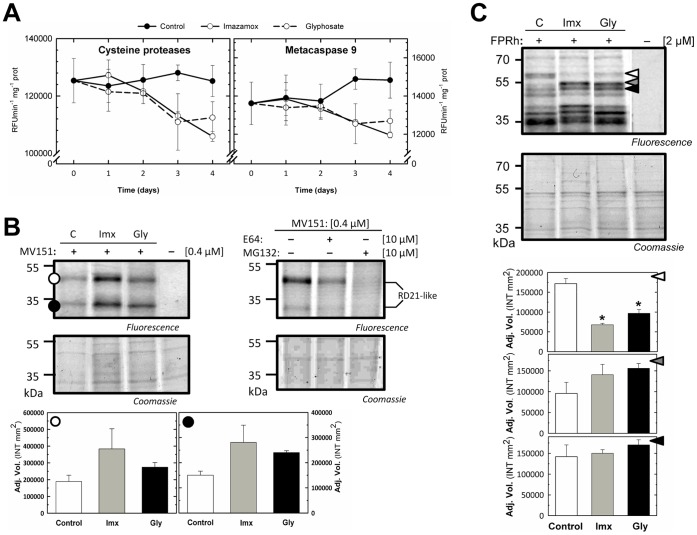
Figure 4. Effect of amino acid biosynthesis inhibitors on other proteases.
(A) Cysteine protease and metacaspase 9 activities assayed using the specific substrates GGR-AMC and VRPR-AMC, respectively, in pea roots treated with herbicides that inhibit amino acid biosynthesis. Means ± SE (n = 3). (B) Left, the labeling profile of PLCPs in pea roots treated with imazamox or glyphosate at day 3 following incubation with 0.4 µM MV151 for 1 h at pH 6.0. Right, a competitive assay in which root extracts were pre-incubated with the inhibitor E64 or MG132 at a concentration of 10 µM for 30 min prior to labeling. The 30–40 kDa signals correspond to RD21 PLCPs. Fluorescently labeled proteins were detected in protein gels via fluorescence scanning, and two bands were observed (• and ○). The signals were quantified using a densitometer, and the relative values are shown in the bar graph. Means ± SE (n = 3). The symbol * indicates significant differences between the control and the treatments (p<0.05). The Coomassie-stained protein gel on the bottom shows the total amounts of input proteins. (C) Labeling profile of serine proteases in pea roots treated with imazamox or glyphosate at day 3 following incubation with 2 µM FPRh for 1 h at RT in the dark. Fluorescently labeled proteins were detected in protein gels via fluorescence scanning, and three bands were detected (white, black and grey left-facing triangles). The signals were quantified using a densitometer, and the relative values are shown in the bar graph. Means ± SE (n = 3). The symbol (*) indicates significant differences between the control and the treatments (p<0.05). The Coomassie-stained protein gel on the bottom shows the total amounts of input proteins.

