
Figure 1.
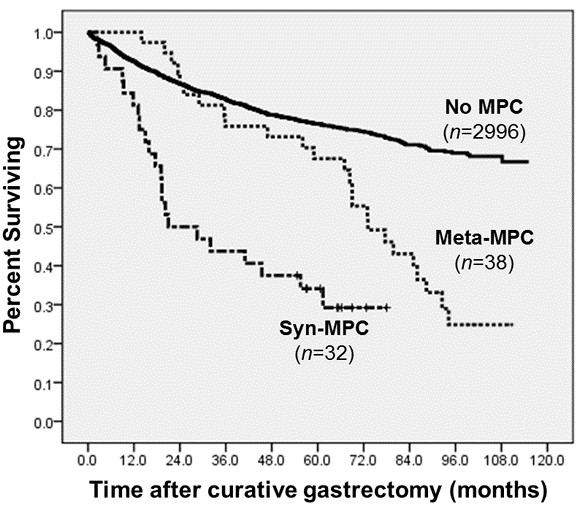
MPC and survival disadvantages in GC patients. The Kaplan-Meyer survival curves according to the type of MPC. P < 0.001 for Meta-MPC vs. No MPC, p < 0.001 for Syn-MPC vs. No MPC.
Official websites use .gov
A
.gov website belongs to an official
government organization in the United States.
Secure .gov websites use HTTPS
A lock (
) or https:// means you've safely
connected to the .gov website. Share sensitive
information only on official, secure websites.
MPC and survival disadvantages in GC patients. The Kaplan-Meyer survival curves according to the type of MPC. P < 0.001 for Meta-MPC vs. No MPC, p < 0.001 for Syn-MPC vs. No MPC.