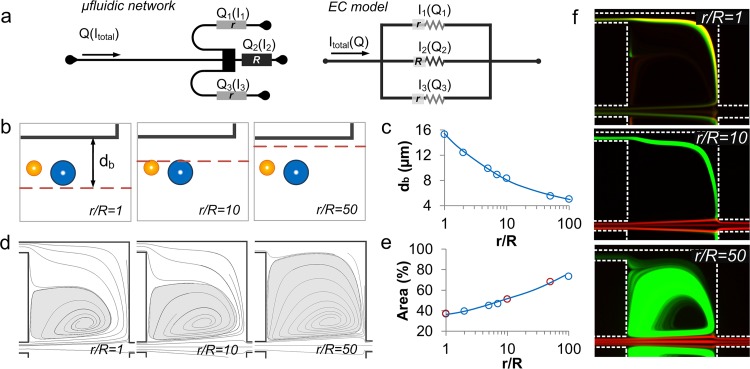
Figure 5.
Optimization of the outlets. (a) Microfluidic network of the device and the corresponding electrical circuit (EC) model. (b) Schematics illustrating shift of boundary streamline at different r/R. (c) ESI CFD-ACE+ simulation illustrates boundary streamline position db for 1 < r/R < 100. (d) ESI CFD-ACE+ simulation demonstrates geometric progression of the vortex at different r/R, and (e) the corresponding quantitative measurements of vortex dimension from both numerical models (blue circles) and experimental (red circles) at for 1 < r/R < 100. (f) Experimental observations illustrate motion of the 23 μm (FITC) and 15.5 μm (TRITC) diameter particles at different r/R ratios at Re = 110.

