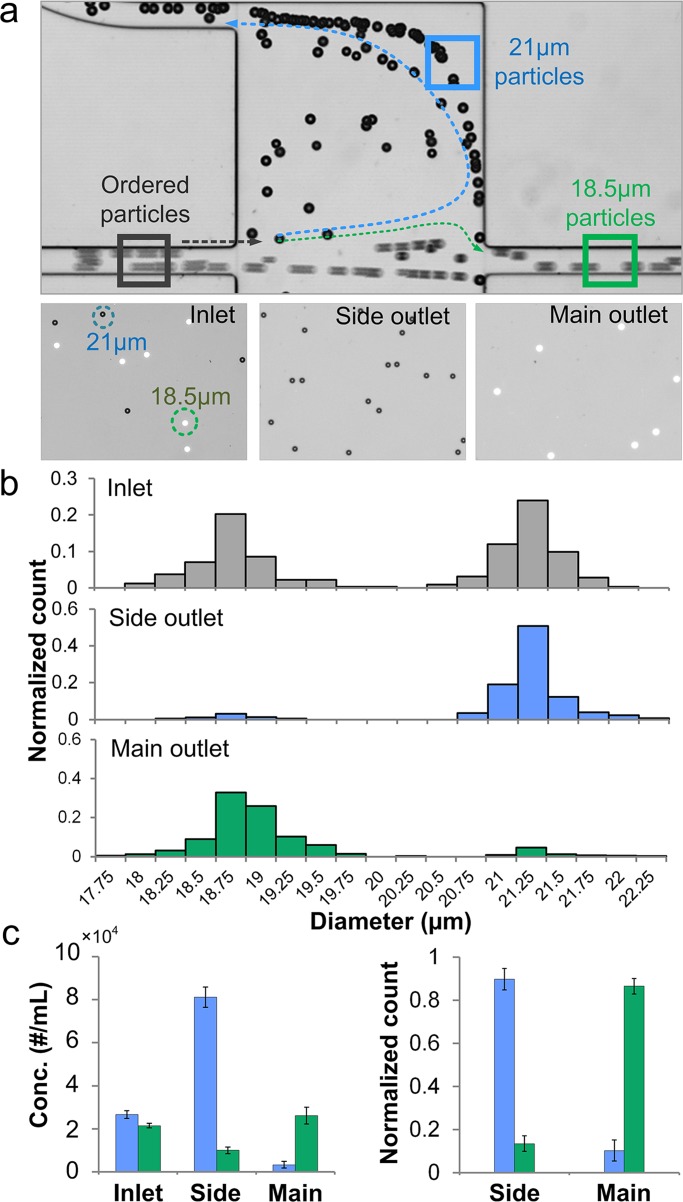
Figure 6.
Ultra-selective separation of 21 μm from 18.5 μm diameter particles in a device with r/R = 5. (a) The top bright-field image shows separation at the device chamber. The lower three images show particles at the inlet, side outlet and main outlet. The black dots are 21 μm diameter non-fluorescent particles in bright-field view. The white dots are fluorescent 18.5 μm diameter particles. (b) Histograms of inlet, side outlet and main outlet samples indicate the efficient separation. (c) Concentration of 21 μm and 18.5 μm diameter particles in inlet, side and main outlet samples. Normalized count shows a separation efficiency of ∼90% for both particles. Error bars represent stand deviation (n = 3).

