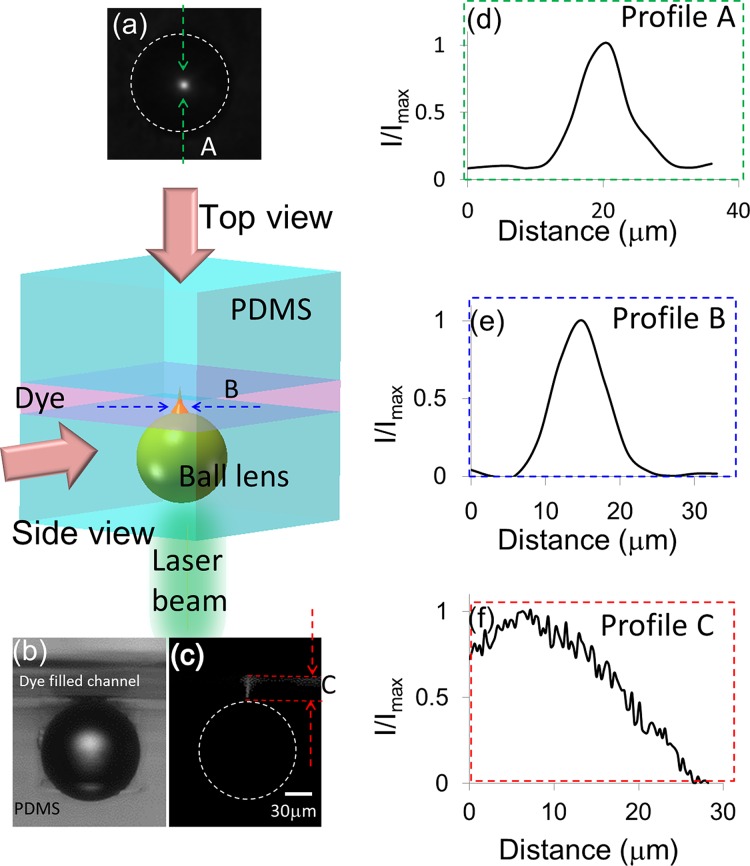
Figure 5.
A light beam propagates through a PDMS embedded 75 μm ball lens and gets focused to excite fluorescence dye in a 30 μm high channel. The fluorescence images are taken by a 10× objective lens on a fluorescence microscope to calibrate the excitation range after the lens. (a) Topview of the fluorescence image captured at the focal point. (b) The bright field and the (c) fluorescent sideview images of a ball lens. A column-shape of fluorescence excitation is observed after the ball lens. (d) The intensity profiles extracted from the topview fluorescence image in (a). (e) The intensity profile extracted from a sideview fluorescence image in (c). It shows the smallest spot size is 5 μm. The intensity distribution along the center propagation axis after the ball lens is plotted in (f). It shows the column-shape excitation beam can penetrate 27 μm deep into the channel.

