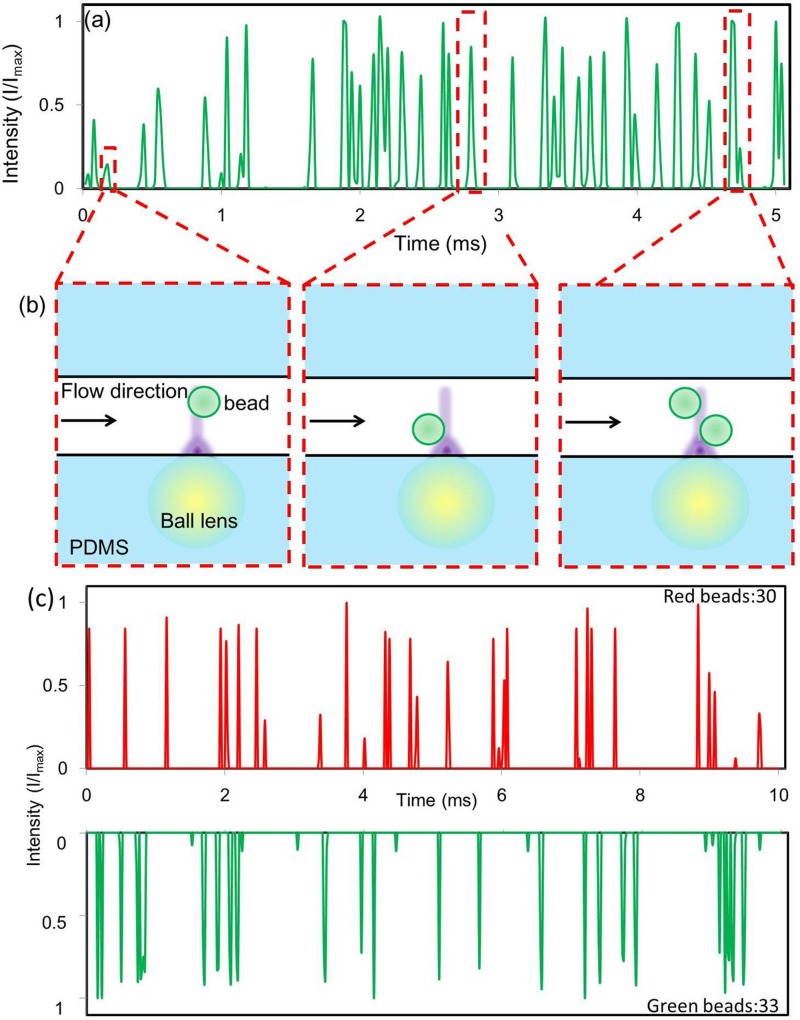
Figure 9.
(a) The results of bead counting using sample 1: green beads with concentration of 2 × 10⁷ beads/ml (b) Three different bead locations can cause different peak intensity profiles in (a). The high camera frame rate and the small excitation spot (∼5 μm) allow our flow cytometer to distinguish closely positioned beads. (c) The results of bead counting using sample 2: green and red beads mixed at a 1:1 ratio with a total concentration of 2 × 10⁷ bead/ml.

