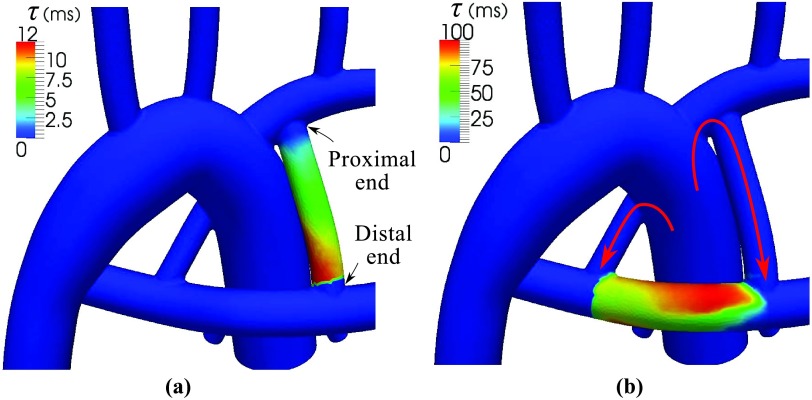
Figure 9.
(a) Spatial distribution of time averaged τ in the BTS. Note the linear distribution due to the unidirectional flow. (b) Spatial distribution of time averaged τ in the PA. Note the higher value at the center of the PA that leads to higher RT1. Due to the high flow rates across the boundaries of the PA-Seg, RT2 has a lower value in this case. The proximal and distal ends of BTS and flow direction in the BTS and PDA are shown.

