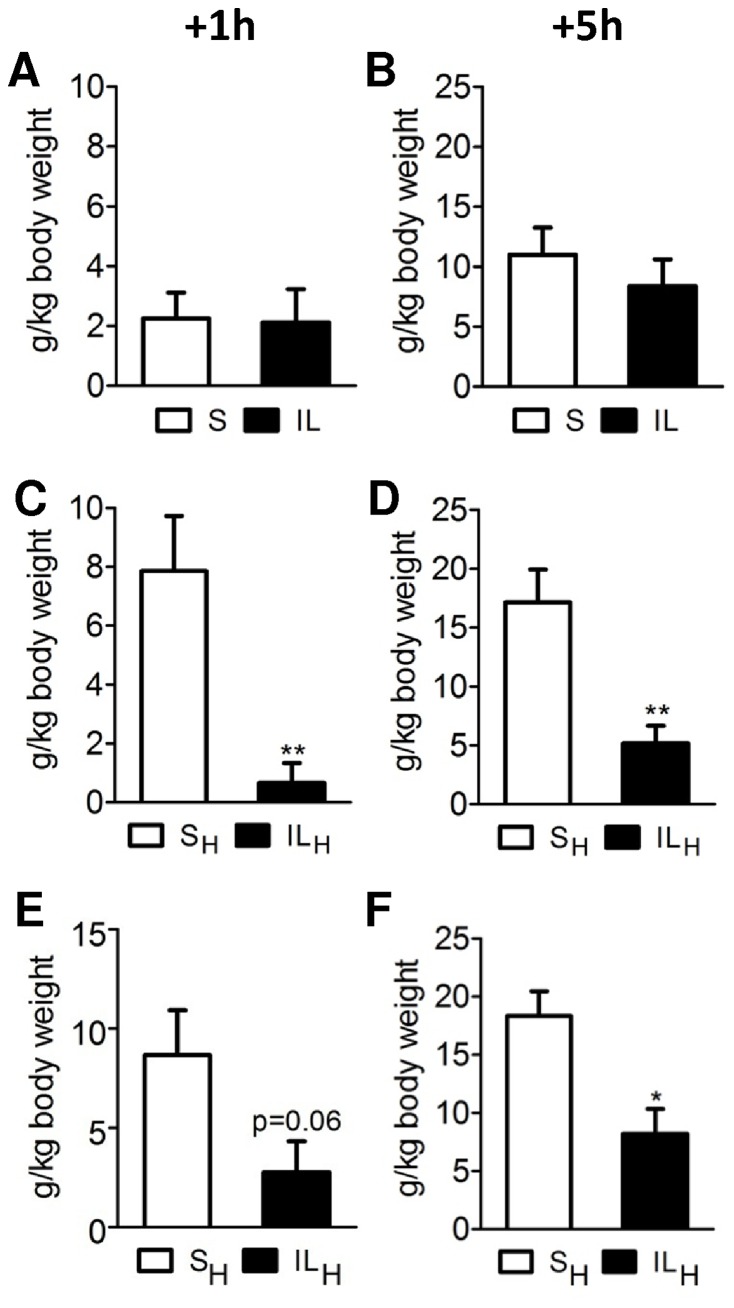
Figure 1. Food intake measurement after 10 min infusion toward brain of saline (S; open bars; control) and Intralipid 20% at 20 µL/min (IL; solid bars) without (A, B) or with heparin (C,D) in Wistar rats.
The same experiment was realized in Sprague Dawley rats (E,F). A, C, E: 1 h-food intake. B, D, F: 5 h-food intake. Values are means ±SEM; n≥6 rats/group. *p<0.05, **p<0.01, significantly different from controls.

