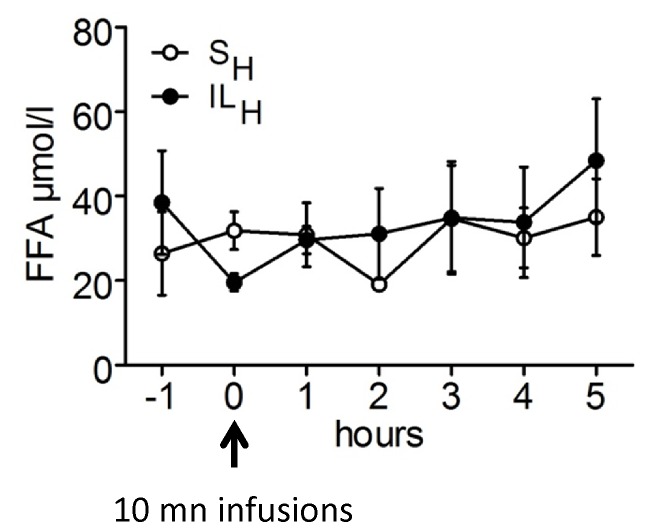
Figure 2. Microdialysis fatty acids concentrations before and after 10 min infusion toward brain of SH or ILH.
A: area under the curve (AUC) for basal (all rats before infusions), SH and ILH groups. AUC is calculated 30 min before the 10 min infusion and 1 h after. B: Time course of microdialysis fatty acids with 0 which is the end of the infusion. Values are means ±SEM; n≥6 rats/group. *p<0.05 significantly different from basal.

