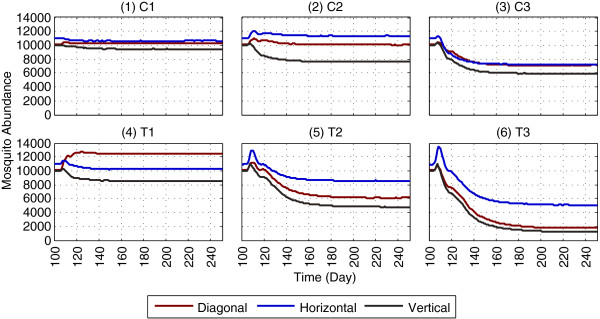
Figure 6.

Impact of LSM on mosquito abundance, using a non-absorbing boundary. The figure depicts the results of applying LSM (in isolation), as the results of GN-LSM [10] are replicated using a non-absorbing boundary. With a non-absorbing boundary, when mosquitoes hit an edge of the landscape’s boundary, they enter the landscape from the edge directly opposite of the exiting edge (and thus are not killed due to hitting the edge). Subfigures (1)-(3), denoted as C1, C2 and C3, refer to the non-targeted, random removal of aquatic habitats. Subfigures (4)-(6), denoted as T1, T2 and T3, refer to the targeted removal of aquatic habitats within 100, 200 and 300 m of surrounding houses. Results within each subfigure are obtained using the same parameters as in the corresponding subfigure of Figure 5 (except the boundary type). For brevity, the 150 days results (day 100 - day 249) are shown; the full one-year results are given in Additional file 8. This figure represents averages of a total of 900 (18 × 50) simulations.
